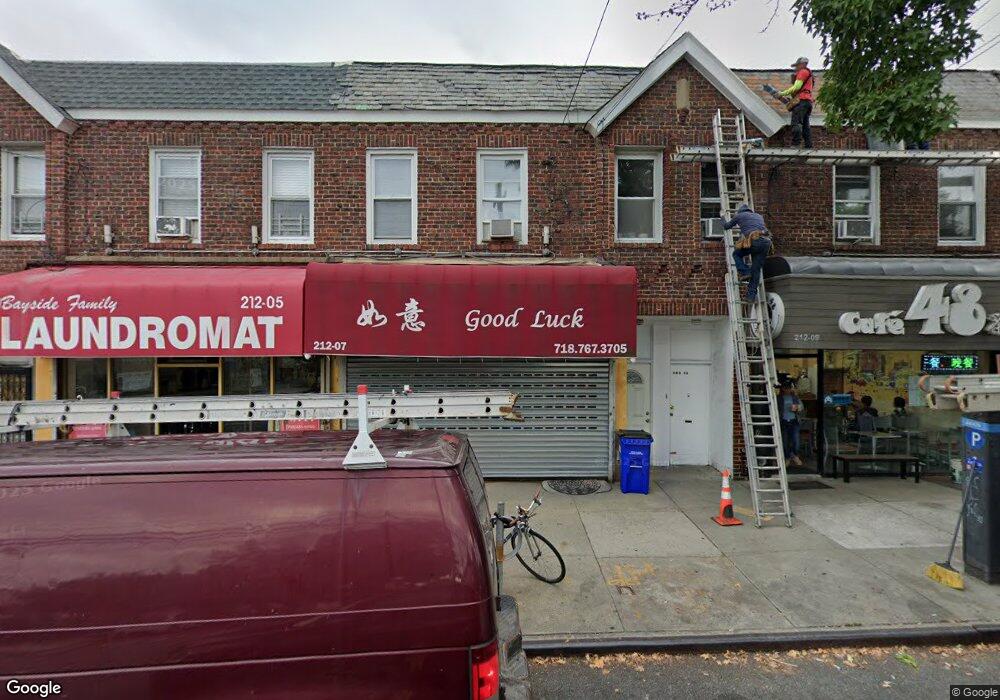
212-07 48th Ave Flushing, NY 11364
Bayside NeighborhoodEstimated Value: $1,256,192
Studio
--
Bath
1,600
Sq Ft
$785/Sq Ft
Est. Value
About This Home
This home is located at 212-07 48th Ave, Flushing, NY 11364 and is currently estimated at $1,256,192, approximately $785 per square foot. 212-07 48th Ave is a home located in Queens County with nearby schools including P.S. 376, P.S. 31 - Bayside, and M.S. 158 - Marie Curie.
Ownership History
Date
Name
Owned For
Owner Type
Purchase Details
Closed on
May 4, 2012
Sold by
1957 Realty Llc
Bought by
5678 Realty Corp
Current Estimated Value
Purchase Details
Closed on
Jun 15, 2004
Sold by
Choi Hwa Ja
Bought by
1957 Realty Llc
Purchase Details
Closed on
Nov 16, 2001
Sold by
Genesis Llc
Bought by
Choi Hwa Ja
Home Financials for this Owner
Home Financials are based on the most recent Mortgage that was taken out on this home.
Original Mortgage
$150,000
Interest Rate
6.6%
Mortgage Type
Commercial
Purchase Details
Closed on
Apr 24, 1996
Sold by
Jan 591 Corp
Bought by
Genesis Llc
Home Financials for this Owner
Home Financials are based on the most recent Mortgage that was taken out on this home.
Original Mortgage
$129,500
Interest Rate
7.77%
Mortgage Type
Commercial
Create a Home Valuation Report for This Property
The Home Valuation Report is an in-depth analysis detailing your home's value as well as a comparison with similar homes in the area
Home Values in the Area
Average Home Value in this Area
Purchase History
| Date | Buyer | Sale Price | Title Company |
|---|---|---|---|
| 5678 Realty Corp | $680,000 | -- | |
| 5678 Realty Corp | $680,000 | -- | |
| 1957 Realty Llc | $534,000 | -- | |
| 1957 Realty Llc | $534,000 | -- | |
| Choi Hwa Ja | -- | -- | |
| Choi Hwa Ja | -- | -- | |
| Genesis Llc | $172,500 | First American Title Ins Co | |
| Genesis Llc | $172,500 | First American Title Ins Co |
Source: Public Records
Mortgage History
| Date | Status | Borrower | Loan Amount |
|---|---|---|---|
| Previous Owner | Choi Hwa Ja | $150,000 | |
| Previous Owner | Genesis Llc | $129,500 |
Source: Public Records
Tax History
| Year | Tax Paid | Tax Assessment Tax Assessment Total Assessment is a certain percentage of the fair market value that is determined by local assessors to be the total taxable value of land and additions on the property. | Land | Improvement |
|---|---|---|---|---|
| 2025 | $15,395 | $140,130 | $34,650 | $105,480 |
| 2024 | $15,395 | $145,350 | $34,650 | $110,700 |
| 2023 | $14,633 | $138,150 | $34,650 | $103,500 |
| 2022 | $14,713 | $136,800 | $34,650 | $102,150 |
| 2021 | $14,293 | $133,650 | $34,650 | $99,000 |
| 2020 | $15,638 | $179,100 | $34,650 | $144,450 |
| 2019 | $13,796 | $175,050 | $34,650 | $140,400 |
| 2018 | $11,866 | $112,860 | $31,770 | $81,090 |
| 2017 | $10,379 | $98,717 | $31,050 | $67,667 |
| 2016 | $9,658 | $98,717 | $31,050 | $67,667 |
| 2015 | $5,119 | $85,305 | $31,050 | $54,255 |
| 2014 | $5,119 | $79,095 | $31,032 | $48,063 |
Source: Public Records
Map
Nearby Homes
- 47-25 212th St
- 212-21 47th Ave
- 21115 48th Ave
- 4634 211th St
- 211-14 46th Ave
- 4713 215th St
- 47-22 215th Place Unit 2B
- 47-22 215th Place Unit 3D
- 215-09 47th Ave Unit 2C
- 46-42 215th Place Unit 1C
- 50-05 212th St
- 47-27 215th Place Unit 1A
- 47-21 215th Place Unit 1 C
- 215-43 48th Ave Unit 3A
- 215-43 48th Ave Unit 3B
- 215-28 47th Ave Unit 1A
- 46-40 216th St Unit 3B
- 47-22 216th St Unit 3D
- 46-31 215th Place Unit 1A
- 45-29 211th St
- 21209 48th Ave
- 21207 48th Ave
- 21205 48th Ave
- 21209 48th Ave
- 21211 48th Ave
- 21203 48th Ave
- 21213 48th Ave Unit 1
- 212-13 48th Ave Unit 1
- 21213 48th Ave
- 4729 212th St
- 4729 212th St
- 21201 48th Ave
- 21201 48th Ave
- 4727 212th St
- 4725 212th St
- 212-09 48th Ave
- 47-38 213th St Unit 2
- 47-38 213th St
- 212-01 48th Ave
- 4738 213th St
Your Personal Tour Guide
Ask me questions while you tour the home.