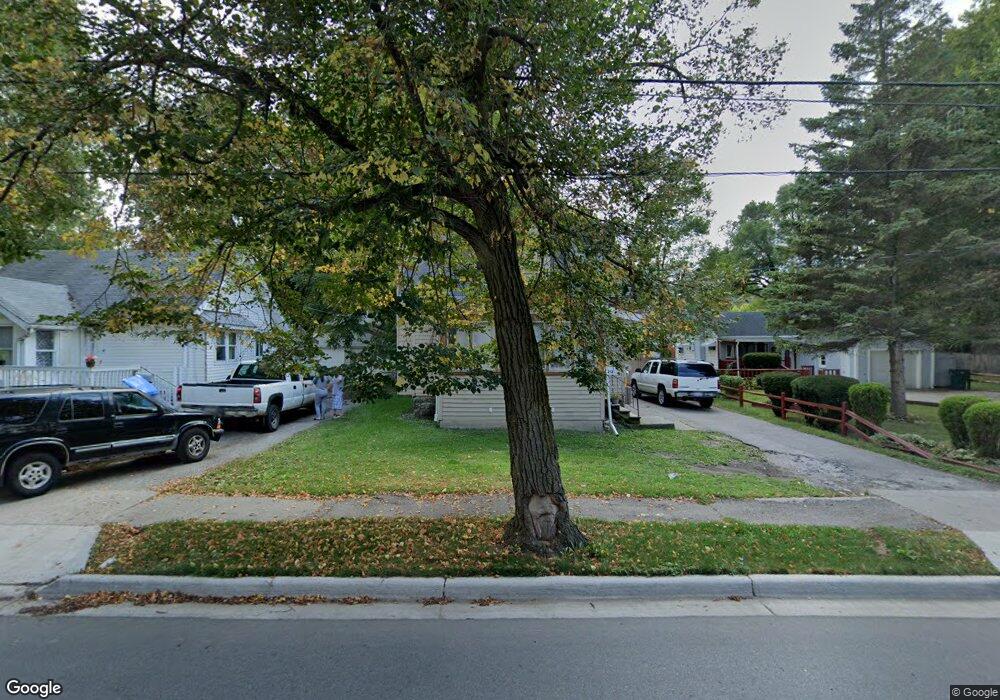
212 E Cavanaugh Rd Lansing, MI 48910
Old Everett NeighborhoodEstimated Value: $100,520 - $127,000
Studio
--
Bath
777
Sq Ft
$154/Sq Ft
Est. Value
About This Home
This home is located at 212 E Cavanaugh Rd, Lansing, MI 48910 and is currently estimated at $119,380, approximately $153 per square foot. 212 E Cavanaugh Rd is a home located in Ingham County with nearby schools including Kendon School, Attwood School, and Everett High School.
Ownership History
Date
Name
Owned For
Owner Type
Purchase Details
Closed on
Nov 20, 2025
Sold by
Jaffer Rozmina Akbarali
Bought by
Dr Rozmina Jaffer Revocable Living Trust
Current Estimated Value
Purchase Details
Closed on
May 12, 2016
Sold by
Jaffer Rozmina A
Bought by
Dr Rozmina Akbarali Jaffer Trust
Purchase Details
Closed on
Jul 31, 2013
Sold by
Schertzing Eric
Bought by
Jaffer Rozmina A
Purchase Details
Closed on
May 13, 2005
Sold by
Castillo Vincent J
Bought by
Castillo John and Castillo Maria
Home Financials for this Owner
Home Financials are based on the most recent Mortgage that was taken out on this home.
Original Mortgage
$71,920
Interest Rate
5.91%
Mortgage Type
Purchase Money Mortgage
Purchase Details
Closed on
Jan 18, 1999
Sold by
Castillo Katrina N
Bought by
Castillo Vince J
Home Financials for this Owner
Home Financials are based on the most recent Mortgage that was taken out on this home.
Original Mortgage
$50,041
Interest Rate
6.76%
Mortgage Type
Purchase Money Mortgage
Purchase Details
Closed on
Feb 1, 1992
Create a Home Valuation Report for This Property
The Home Valuation Report is an in-depth analysis detailing your home's value as well as a comparison with similar homes in the area
Home Values in the Area
Average Home Value in this Area
Purchase History
| Date | Buyer | Sale Price | Title Company |
|---|---|---|---|
| Dr Rozmina Jaffer Revocable Living Trust | -- | None Listed On Document | |
| Dr Rozmina Akbarali Jaffer Trust | -- | None Available | |
| Jaffer Rozmina A | -- | None Available | |
| Castillo John | $89,900 | Bell Title Company | |
| Castillo Vince J | -- | -- | |
| -- | $40,000 | -- |
Source: Public Records
Mortgage History
| Date | Status | Borrower | Loan Amount |
|---|---|---|---|
| Previous Owner | Castillo John | $71,920 | |
| Previous Owner | Castillo Vince J | $50,041 |
Source: Public Records
Tax History
| Year | Tax Paid | Tax Assessment Tax Assessment Total Assessment is a certain percentage of the fair market value that is determined by local assessors to be the total taxable value of land and additions on the property. | Land | Improvement |
|---|---|---|---|---|
| 2025 | $2,651 | $54,100 | $7,200 | $46,900 |
| 2024 | $22 | $44,200 | $7,200 | $37,000 |
| 2023 | $2,496 | $40,300 | $7,200 | $33,100 |
| 2022 | $2,279 | $34,400 | $6,600 | $27,800 |
| 2021 | $2,227 | $31,800 | $3,900 | $27,900 |
| 2020 | $2,211 | $30,200 | $3,900 | $26,300 |
| 2019 | $2,136 | $29,200 | $3,900 | $25,300 |
| 2018 | $2,025 | $27,600 | $3,900 | $23,700 |
| 2017 | $1,949 | $27,600 | $3,900 | $23,700 |
| 2016 | $3,515 | $26,000 | $3,900 | $22,100 |
| 2015 | $3,515 | $25,100 | $7,768 | $17,332 |
| 2014 | $3,515 | $25,000 | $4,855 | $20,145 |
Source: Public Records
Map
Nearby Homes
- 106 E Everettdale Ave
- 111 E Potter Ave
- 4022 Stabler St
- 522 E Cavanaugh Rd
- 221 W Everettdale Ave
- 201 E Syringa Dr
- 3805 Donald St
- 600 E Cavanaugh Rd
- 601 Jessop Ave
- 629 Emily Ave
- 709 Jessop Ave
- 600 W Cavanaugh Rd
- 705 Hunter Blvd
- 817 Jessop Ave
- 3723 Weger Place
- 616 Glendale Ave
- 801 Jessop Ave
- 4125 Lowcroft Ave
- 3824 Schlee St
- 3319 Jewell Ave
- 216 E Cavanaugh Rd
- 206 E Cavanaugh Rd
- 222 E Cavanaugh Rd
- 211 E Graham Ave
- 215 E Graham Ave
- 205 E Graham Ave
- 215 E Cavanaugh Rd
- 4316 Donald St
- 201 E Graham Ave
- 124 E Cavanaugh Rd
- 201 E Cavanaugh Rd
- 125 E Cavanaugh Rd
- 300 E Cavanaugh Rd
- 208 E Graham Ave
- 119 E Graham Ave
- 214 E Graham Ave
- 114 E Cavanaugh Rd
- 200 E Graham Ave
- 306 E Cavanaugh Rd
Your Personal Tour Guide
Ask me questions while you tour the home.