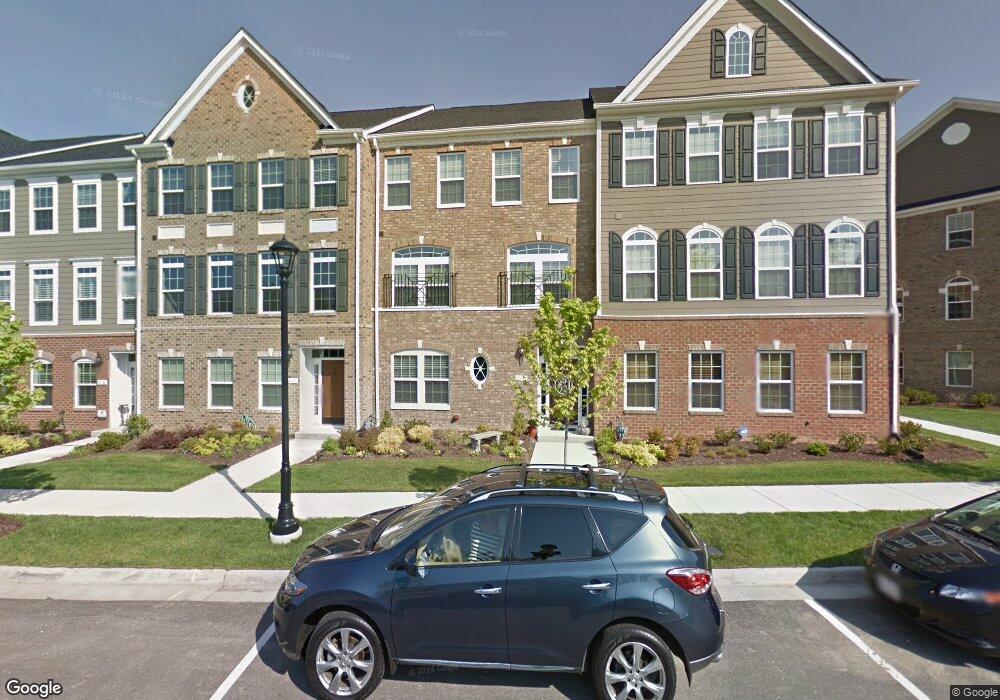
212 Geese Landing Glen Allen, VA 23060
Short Pump NeighborhoodEstimated Value: $584,142 - $649,000
3
Beds
4
Baths
2,892
Sq Ft
$211/Sq Ft
Est. Value
About This Home
This home is located at 212 Geese Landing, Glen Allen, VA 23060 and is currently estimated at $610,036, approximately $210 per square foot. 212 Geese Landing is a home located in Henrico County with nearby schools including Colonial Trail Elementary School, Short Pump Middle School, and Deep Run High School.
Ownership History
Date
Name
Owned For
Owner Type
Purchase Details
Closed on
Aug 10, 2022
Sold by
Lee Moses J and Lee Jungyim
Bought by
Hackenberg Leo A and Hackenberg Jenni L
Current Estimated Value
Home Financials for this Owner
Home Financials are based on the most recent Mortgage that was taken out on this home.
Original Mortgage
$513,000
Outstanding Balance
$490,571
Interest Rate
5.54%
Mortgage Type
Balloon
Estimated Equity
$119,465
Purchase Details
Closed on
Aug 15, 2016
Sold by
Chenault Lillian B
Bought by
Lee Moses J and Lee Jungyim
Home Financials for this Owner
Home Financials are based on the most recent Mortgage that was taken out on this home.
Original Mortgage
$446,906
Interest Rate
3.41%
Mortgage Type
VA
Purchase Details
Closed on
Jun 3, 2014
Sold by
Nvr Inc
Bought by
Chenault Lillian B
Home Financials for this Owner
Home Financials are based on the most recent Mortgage that was taken out on this home.
Original Mortgage
$307,000
Interest Rate
4.27%
Mortgage Type
New Conventional
Create a Home Valuation Report for This Property
The Home Valuation Report is an in-depth analysis detailing your home's value as well as a comparison with similar homes in the area
Home Values in the Area
Average Home Value in this Area
Purchase History
| Date | Buyer | Sale Price | Title Company |
|---|---|---|---|
| Hackenberg Leo A | $540,000 | Title Resource Guaranty Compan | |
| Lee Moses J | $437,500 | Attorney | |
| Chenault Lillian B | $437,041 | -- |
Source: Public Records
Mortgage History
| Date | Status | Borrower | Loan Amount |
|---|---|---|---|
| Open | Hackenberg Leo A | $513,000 | |
| Previous Owner | Lee Moses J | $446,906 | |
| Previous Owner | Chenault Lillian B | $307,000 |
Source: Public Records
Tax History Compared to Growth
Tax History
| Year | Tax Paid | Tax Assessment Tax Assessment Total Assessment is a certain percentage of the fair market value that is determined by local assessors to be the total taxable value of land and additions on the property. | Land | Improvement |
|---|---|---|---|---|
| 2025 | $4,705 | $536,300 | $115,000 | $421,300 |
| 2024 | $4,705 | $511,100 | $115,000 | $396,100 |
| 2023 | $4,344 | $511,100 | $115,000 | $396,100 |
| 2022 | $3,972 | $467,300 | $95,000 | $372,300 |
| 2021 | $3,722 | $427,800 | $85,000 | $342,800 |
| 2020 | $3,722 | $427,800 | $85,000 | $342,800 |
| 2019 | $3,722 | $427,800 | $85,000 | $342,800 |
| 2018 | $3,722 | $427,800 | $85,000 | $342,800 |
| 2017 | $3,635 | $417,800 | $85,000 | $332,800 |
| 2016 | $3,560 | $409,200 | $85,000 | $324,200 |
| 2015 | $1,967 | $409,200 | $85,000 | $324,200 |
| 2014 | $1,967 | $85,000 | $85,000 | $0 |
Source: Public Records
Map
Nearby Homes
- 3928 Lantern View Place
- Linden Terrace Plan at West Broad Village
- Hartford Terrace Plan at West Broad Village
- 3932 Lantern View Place
- 1704 Old Brick Rd Unit A
- 1724 Old Brick Rd Unit A
- 115 Wellie Hill Place Unit A
- 2527 Perch Ln
- Everly Plan at Sadler Square
- Arden Plan at Sadler Square
- Crosby Plan at Sadler Square
- 11117 Woodbaron Ct
- 11568 Chapman Mill Dr
- 11464 Sligo Dr
- 0 Sligo Dr
- 11468 Sligo Dr
- Stonefield Plan at Nantucket Mews
- Saybrook Plan at Nantucket Mews
- Astoria Plan at Nantucket Mews
- Montauk Plan at Nantucket Mews
- 212 Geese Landing Unit 212
- 214 Geese Landing
- 210 Geese Landing
- 216 Geese Landing
- 208 Geese Landing
- 206 Geese Landing Unit 206
- 206 Geese Landing
- 220 Geese Landing
- 3807 Pumpkin Seed Ln
- 204 Geese Landing Unit 204
- 204 Geese Landing
- 3809 Pumpkin Seed Ln
- 222 Geese Landing
- 202 Geese Landing
- 1801 Liesfeld Pkwy
- 224 Geese Landing
- 1803 Liesfeld Pkwy Unit 1803
- 1803 Liesfeld Pkwy
- 3805 Pumpkin Seed Ln
- 200 Geese Landing