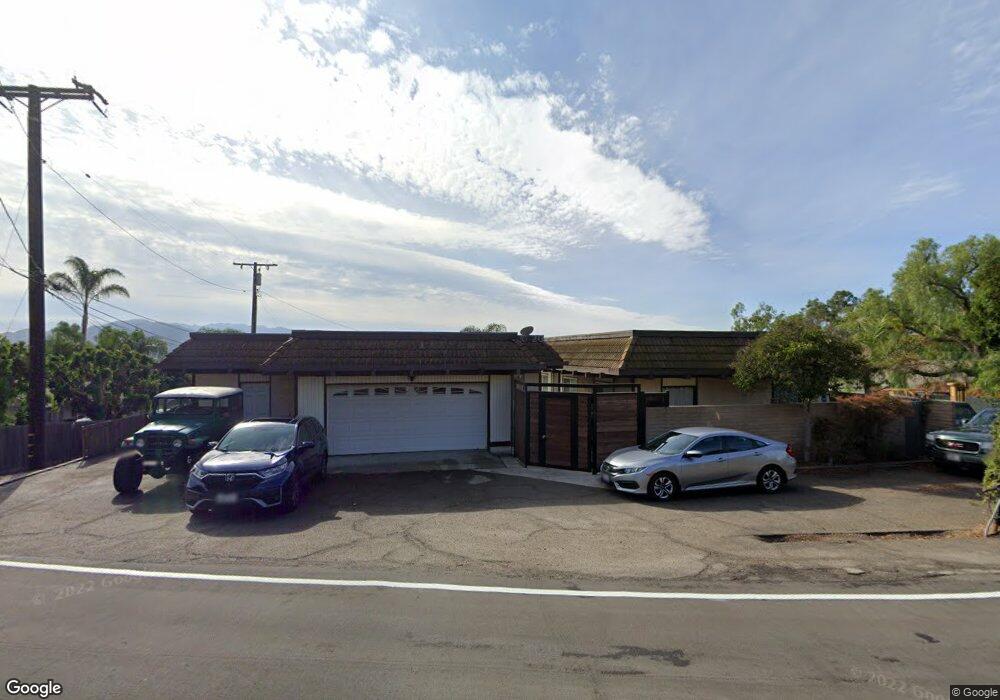
212 N Loop Dr Camarillo, CA 93010
Estimated Value: $1,047,000 - $1,135,000
3
Beds
2
Baths
1,859
Sq Ft
$583/Sq Ft
Est. Value
About This Home
This home is located at 212 N Loop Dr, Camarillo, CA 93010 and is currently estimated at $1,084,386, approximately $583 per square foot. 212 N Loop Dr is a home located in Ventura County with nearby schools including Camarillo Heights Elementary School, Monte Vista Middle School, and Adolfo Camarillo High School.
Ownership History
Date
Name
Owned For
Owner Type
Purchase Details
Closed on
Sep 2, 2004
Sold by
Kim Susie and Kim Kimberly
Bought by
Kim Jason
Current Estimated Value
Home Financials for this Owner
Home Financials are based on the most recent Mortgage that was taken out on this home.
Original Mortgage
$287,200
Outstanding Balance
$122,341
Interest Rate
3.81%
Mortgage Type
Purchase Money Mortgage
Estimated Equity
$962,045
Purchase Details
Closed on
Nov 3, 1997
Sold by
Kim Wang Ki
Bought by
Kim Susie
Home Financials for this Owner
Home Financials are based on the most recent Mortgage that was taken out on this home.
Original Mortgage
$180,000
Interest Rate
7.23%
Purchase Details
Closed on
Oct 13, 1997
Sold by
Johnson Don D and Johnson Mary D
Bought by
Kim Susie and Kim Kimberly
Home Financials for this Owner
Home Financials are based on the most recent Mortgage that was taken out on this home.
Original Mortgage
$180,000
Interest Rate
7.23%
Create a Home Valuation Report for This Property
The Home Valuation Report is an in-depth analysis detailing your home's value as well as a comparison with similar homes in the area
Home Values in the Area
Average Home Value in this Area
Purchase History
| Date | Buyer | Sale Price | Title Company |
|---|---|---|---|
| Kim Jason | $710,000 | Fidelity National Title Co | |
| Kim Susie | -- | Lawyers Title Company | |
| Kim Susie | $245,000 | Lawyers Title Company |
Source: Public Records
Mortgage History
| Date | Status | Borrower | Loan Amount |
|---|---|---|---|
| Open | Kim Jason | $287,200 | |
| Closed | Kim Susie | $180,000 |
Source: Public Records
Tax History
| Year | Tax Paid | Tax Assessment Tax Assessment Total Assessment is a certain percentage of the fair market value that is determined by local assessors to be the total taxable value of land and additions on the property. | Land | Improvement |
|---|---|---|---|---|
| 2025 | $7,585 | $690,412 | $521,951 | $168,461 |
| 2024 | $7,585 | $676,875 | $511,717 | $165,158 |
| 2023 | $7,313 | $663,603 | $501,683 | $161,920 |
| 2022 | $7,292 | $650,592 | $491,846 | $158,746 |
| 2021 | $7,030 | $637,836 | $482,202 | $155,634 |
| 2020 | $7,005 | $631,297 | $477,258 | $154,039 |
| 2019 | $6,974 | $618,919 | $467,900 | $151,019 |
| 2018 | $6,846 | $606,784 | $458,726 | $148,058 |
| 2017 | $6,443 | $594,887 | $449,732 | $145,155 |
| 2016 | $6,289 | $583,223 | $440,914 | $142,309 |
| 2015 | $6,223 | $574,464 | $434,292 | $140,172 |
| 2014 | $5,417 | $501,000 | $378,000 | $123,000 |
Source: Public Records
Map
Nearby Homes
- 567 Mesa Dr
- 520 E Highland Dr
- 928 Mission Dr
- 542 San Clemente Way
- 2496 Parkway Dr
- 999 San Clemente Way
- 67 Santa Cruz Way
- 2274 Via Tomas
- 2086 El Rancho Dr
- 2251 Camilar Dr
- 894 W Highland Dr
- 244 W Highland Dr
- 641 LOT B Ocean View Dr
- 2228 Camilar Dr
- 131 San Miguel Dr
- 702 W Highland Dr
- 375 W Highland Dr
- 2103 Euclid Ave
- 1820 Temple Ave
- 1709 Las Posas Rd
Your Personal Tour Guide
Ask me questions while you tour the home.