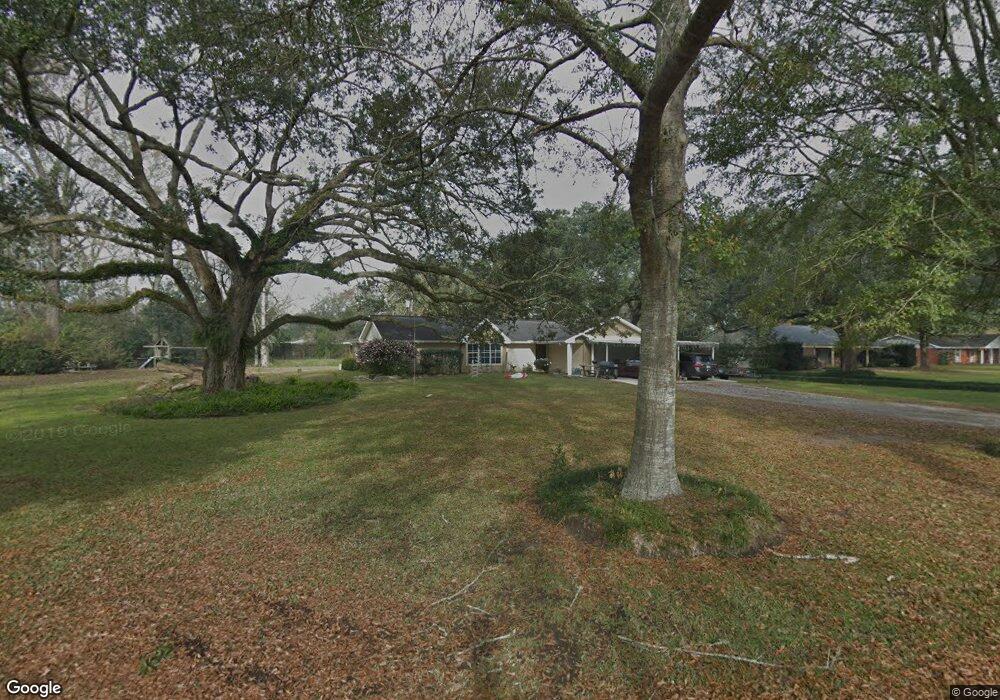
212 N Oak Ct Luling, LA 70070
Estimated Value: $310,000 - $379,000
4
Beds
2
Baths
2,009
Sq Ft
$167/Sq Ft
Est. Value
About This Home
This home is located at 212 N Oak Ct, Luling, LA 70070 and is currently estimated at $334,787, approximately $166 per square foot. 212 N Oak Ct is a home located in St. Charles Parish with nearby schools including Luling Elementary School, R.K. Smith Middle School, and Hahnville High School.
Ownership History
Date
Name
Owned For
Owner Type
Purchase Details
Closed on
Apr 5, 2007
Sold by
Vanvanerman Michelle Van and Fairfield Marvin L
Bought by
Champagne Michael Charles
Current Estimated Value
Home Financials for this Owner
Home Financials are based on the most recent Mortgage that was taken out on this home.
Original Mortgage
$234,555
Outstanding Balance
$138,584
Interest Rate
6.19%
Mortgage Type
New Conventional
Estimated Equity
$196,203
Purchase Details
Closed on
Aug 31, 2006
Sold by
Minard John W and Holt Minard Ann
Bought by
Fairfield Marvin L and Van Erman Fairfield Michelle
Home Financials for this Owner
Home Financials are based on the most recent Mortgage that was taken out on this home.
Original Mortgage
$46,000
Interest Rate
6.28%
Mortgage Type
Stand Alone Second
Create a Home Valuation Report for This Property
The Home Valuation Report is an in-depth analysis detailing your home's value as well as a comparison with similar homes in the area
Home Values in the Area
Average Home Value in this Area
Purchase History
| Date | Buyer | Sale Price | Title Company |
|---|---|---|---|
| Champagne Michael Charles | $246,900 | Title Source | |
| Fairfield Marvin L | $230,000 | None Available |
Source: Public Records
Mortgage History
| Date | Status | Borrower | Loan Amount |
|---|---|---|---|
| Open | Champagne Michael Charles | $234,555 | |
| Previous Owner | Fairfield Marvin L | $46,000 | |
| Previous Owner | Fairfield Marvin L | $184,000 |
Source: Public Records
Tax History
| Year | Tax Paid | Tax Assessment Tax Assessment Total Assessment is a certain percentage of the fair market value that is determined by local assessors to be the total taxable value of land and additions on the property. | Land | Improvement |
|---|---|---|---|---|
| 2025 | $1,759 | $24,900 | $5,550 | $19,350 |
| 2024 | $1,759 | $24,900 | $5,550 | $19,350 |
| 2023 | $1,786 | $20,174 | $4,400 | $15,774 |
| 2022 | $2,359 | $20,174 | $4,400 | $15,774 |
| 2021 | $1,974 | $16,737 | $3,960 | $12,777 |
| 2020 | $2,384 | $20,174 | $4,400 | $15,774 |
| 2019 | $2,342 | $19,752 | $2,120 | $17,632 |
| 2018 | $2,324 | $19,752 | $2,120 | $17,632 |
| 2017 | $2,321 | $19,752 | $2,120 | $17,632 |
| 2016 | $2,331 | $19,752 | $2,120 | $17,632 |
| 2015 | $1,441 | $19,752 | $2,120 | $17,632 |
| 2014 | $1,388 | $19,752 | $2,120 | $17,632 |
| 2013 | $1,393 | $19,752 | $2,120 | $17,632 |
Source: Public Records
Map
Nearby Homes
- 301 Allie Ln
- 320 Allie Ln
- 214 Ashton Oaks Ln
- 112 Allie Ln
- 1216 Gassen St
- 1214 Gassen St
- 405 Ashton Oaks Ln
- 1262 Luling Estates Dr
- 80 Boutte Estates Dr
- 1008 Gassen St
- 204 Lac Segnette Dr
- 109 Lac Cypriere Dr
- 118 Lac Segnette Dr
- 181 Boutte Estates Dr
- 225 Cove Pointe Dr
- 184 Boutte Estates Dr
- 176 Boutte Estates Dr
- 198 N Oak Ct
- 228 N Oak Ct
- 1484 Paul Maillard Rd
- 1490 Paul Maillard Rd
- 188 N Oak Ct
- 1464 Paul Maillard Rd
- 1500 Paul Maillard Rd
- 211 N Oak Ct
- 1460 Paul Maillard Rd
- 227 N Oak Ct
- 1355 Paul Fredrick St
- 199 N Oak Ct
- 1349 Paul Fredrick St
- 1337 Paul Fredrick St
- 1450 Paul Maillard Rd
- 176 N Oak Ct
- 1514 Paul Maillard Rd
- 1343 Paul Fredrick St
- 187 N Oak Ct
- 1332 Paul Fredrick St
Your Personal Tour Guide
Ask me questions while you tour the home.