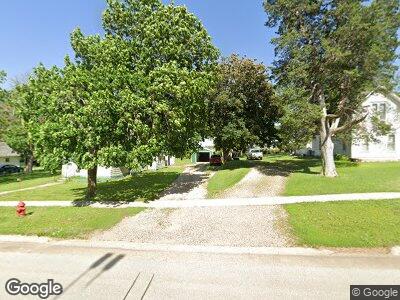
212 S Main St Quimby, IA 51049
Estimated Value: $48,626 - $85,000
2
Beds
3
Baths
1,204
Sq Ft
$59/Sq Ft
Est. Value
About This Home
This home is located at 212 S Main St, Quimby, IA 51049 and is currently estimated at $70,657, approximately $58 per square foot. 212 S Main St is a home located in Cherokee County with nearby schools including River Valley Elementary School and River Valley Junior/Senior High School.
Ownership History
Date
Name
Owned For
Owner Type
Purchase Details
Closed on
Dec 9, 2005
Sold by
Frizzell Gary D and Frizzell Vickie Diane
Bought by
Cross Daniel P and Ludvigson Kristine A
Current Estimated Value
Home Financials for this Owner
Home Financials are based on the most recent Mortgage that was taken out on this home.
Original Mortgage
$12,800
Interest Rate
6.34%
Mortgage Type
New Conventional
Purchase Details
Closed on
Sep 19, 2005
Sold by
Ludvigson Kristine A and Ludvigson Kristin A
Bought by
Bugh Michael E
Home Financials for this Owner
Home Financials are based on the most recent Mortgage that was taken out on this home.
Original Mortgage
$12,800
Interest Rate
6.34%
Mortgage Type
New Conventional
Purchase Details
Closed on
Sep 15, 2005
Sold by
Ludvigson Kristine A and Ludvigson Kristin A
Bought by
Bugh Michael E
Home Financials for this Owner
Home Financials are based on the most recent Mortgage that was taken out on this home.
Original Mortgage
$12,800
Interest Rate
6.34%
Mortgage Type
New Conventional
Create a Home Valuation Report for This Property
The Home Valuation Report is an in-depth analysis detailing your home's value as well as a comparison with similar homes in the area
Home Values in the Area
Average Home Value in this Area
Purchase History
| Date | Buyer | Sale Price | Title Company |
|---|---|---|---|
| Cross Daniel P | $15,000 | None Available | |
| Bugh Michael E | $16,000 | None Available |
Source: Public Records
Mortgage History
| Date | Status | Borrower | Loan Amount |
|---|---|---|---|
| Previous Owner | Cross Daniel P | $12,800 | |
| Previous Owner | Bugh Michael E | $12,800 |
Source: Public Records
Tax History Compared to Growth
Tax History
| Year | Tax Paid | Tax Assessment Tax Assessment Total Assessment is a certain percentage of the fair market value that is determined by local assessors to be the total taxable value of land and additions on the property. | Land | Improvement |
|---|---|---|---|---|
| 2024 | $406 | $37,150 | $4,770 | $32,380 |
| 2023 | $296 | $37,150 | $4,770 | $32,380 |
| 2022 | $268 | $25,650 | $4,770 | $20,880 |
| 2021 | $268 | $25,650 | $4,770 | $20,880 |
| 2020 | $278 | $25,650 | $4,770 | $20,880 |
| 2019 | $300 | $25,650 | $0 | $0 |
| 2018 | $214 | $20,645 | $0 | $0 |
| 2017 | $222 | $20,645 | $0 | $0 |
| 2016 | $210 | $20,645 | $0 | $0 |
| 2015 | $160 | $17,645 | $0 | $0 |
| 2014 | $160 | $17,645 | $0 | $0 |
Source: Public Records
Map
Nearby Homes