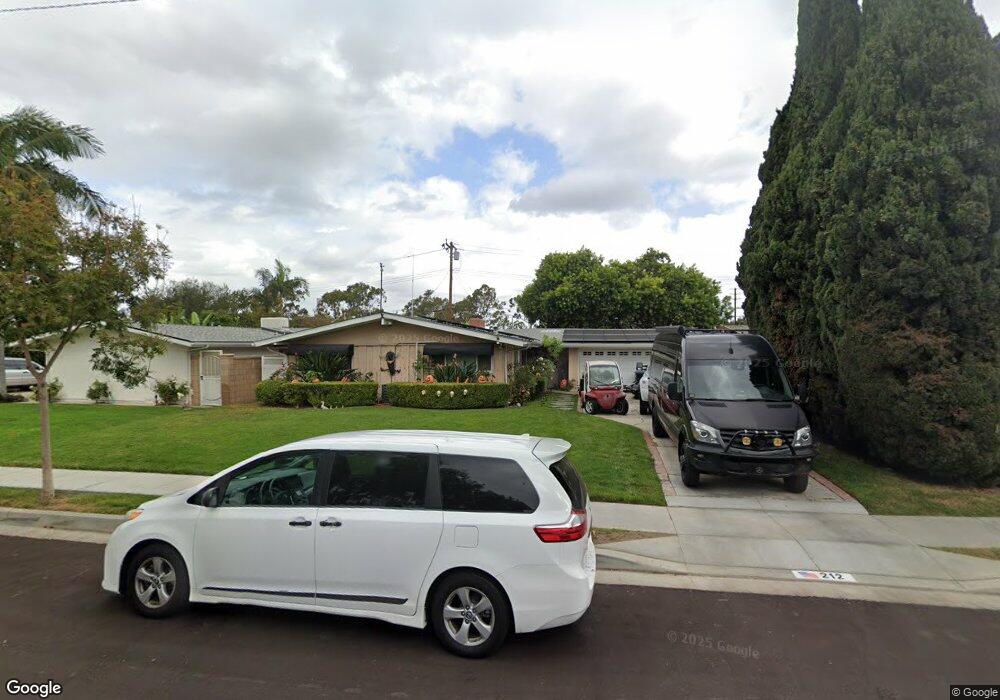
212 Wellesley Ln Costa Mesa, CA 92626
Estimated Value: $1,159,000 - $1,504,000
3
Beds
2
Baths
1,379
Sq Ft
$993/Sq Ft
Est. Value
About This Home
This home is located at 212 Wellesley Ln, Costa Mesa, CA 92626 and is currently estimated at $1,369,048, approximately $992 per square foot. 212 Wellesley Ln is a home located in Orange County with nearby schools including College Park Elementary School, Costa Mesa High School, and Montessori Christian School.
Ownership History
Date
Name
Owned For
Owner Type
Purchase Details
Closed on
Mar 18, 2009
Sold by
Fisher Amy
Bought by
Fisher E Ashley
Current Estimated Value
Home Financials for this Owner
Home Financials are based on the most recent Mortgage that was taken out on this home.
Original Mortgage
$314,000
Outstanding Balance
$199,873
Interest Rate
5.15%
Mortgage Type
New Conventional
Estimated Equity
$1,169,175
Purchase Details
Closed on
Jan 8, 1998
Sold by
Blackman Donna H
Bought by
Fisher E Ashley
Home Financials for this Owner
Home Financials are based on the most recent Mortgage that was taken out on this home.
Original Mortgage
$180,500
Interest Rate
7.05%
Purchase Details
Closed on
Mar 18, 1994
Sold by
Blackman Donna H
Bought by
Blackman Donna H
Home Financials for this Owner
Home Financials are based on the most recent Mortgage that was taken out on this home.
Original Mortgage
$130,000
Interest Rate
4.87%
Create a Home Valuation Report for This Property
The Home Valuation Report is an in-depth analysis detailing your home's value as well as a comparison with similar homes in the area
Home Values in the Area
Average Home Value in this Area
Purchase History
| Date | Buyer | Sale Price | Title Company |
|---|---|---|---|
| Fisher E Ashley | -- | Commerce Title Company | |
| Fisher E Ashley | $190,000 | Orange Coast Title | |
| Blackman Donna H | -- | Orange Coast Title |
Source: Public Records
Mortgage History
| Date | Status | Borrower | Loan Amount |
|---|---|---|---|
| Open | Fisher E Ashley | $314,000 | |
| Closed | Fisher E Ashley | $180,500 | |
| Previous Owner | Blackman Donna H | $130,000 |
Source: Public Records
Tax History Compared to Growth
Tax History
| Year | Tax Paid | Tax Assessment Tax Assessment Total Assessment is a certain percentage of the fair market value that is determined by local assessors to be the total taxable value of land and additions on the property. | Land | Improvement |
|---|---|---|---|---|
| 2025 | $4,067 | $303,367 | $207,072 | $96,295 |
| 2024 | $4,067 | $297,419 | $203,012 | $94,407 |
| 2023 | $3,901 | $291,588 | $199,032 | $92,556 |
| 2022 | $3,724 | $285,871 | $195,129 | $90,742 |
| 2021 | $3,588 | $280,266 | $191,303 | $88,963 |
| 2020 | $3,539 | $277,393 | $189,342 | $88,051 |
| 2019 | $3,461 | $271,954 | $185,629 | $86,325 |
| 2018 | $3,391 | $266,622 | $181,989 | $84,633 |
| 2017 | $3,336 | $261,395 | $178,421 | $82,974 |
| 2016 | $3,269 | $256,270 | $174,922 | $81,348 |
| 2015 | $3,236 | $252,421 | $172,294 | $80,127 |
| 2014 | $3,164 | $247,477 | $168,919 | $78,558 |
Source: Public Records
Map
Nearby Homes
- 117 Clearbrook Ln
- 101 Clearbrook Ln
- 135 Morristown Ln
- 2404 Niagara Way
- 2408 Saratoga Way
- 2330 Vanguard Way Unit F102
- 2371 Rutgers Dr
- 403 Aura Dr
- 2314 Colgate Dr
- 2323 Cornell Dr
- 419 Aura Dr
- 2273 Columbia Dr
- 2547 Cornerstone Ln
- 1202 Hazel Place
- 2459 Elden Ave
- 2750 San Carlos Ln
- 380 W Wilson St Unit C101
- 2865 Mendoza Dr
- 1030 Palmetto Way
- 2649 Elden Ave Unit E
- 208 Wellesley Ln
- 218 Wellesley Ln
- 213 Hanover Dr
- 222 Wellesley Ln
- 202 Wellesley Ln
- 207 Hanover Dr
- 219 Hanover Dr
- 213 Wellesley Ln
- 223 Hanover Dr
- 201 Hanover Dr
- 219 Wellesley Ln
- 209 Wellesley Ln
- 2572 Columbia Dr
- 223 Wellesley Ln
- 203 Wellesley Ln
- 229 Hanover Dr
- 229 Wellesley Ln
- 212 Princeton Dr
- 212 Hanover Dr
- 218 Princeton Dr