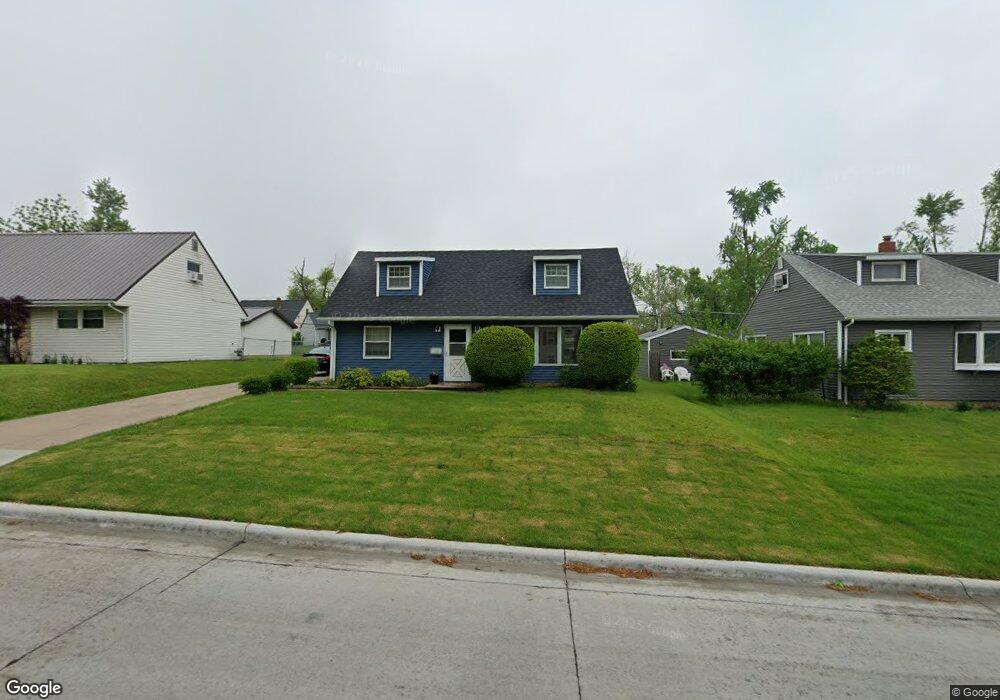
2120 Chandler St SW Cedar Rapids, IA 52404
Cleveland Area NeighborhoodEstimated Value: $168,862 - $184,000
3
Beds
2
Baths
1,481
Sq Ft
$119/Sq Ft
Est. Value
About This Home
This home is located at 2120 Chandler St SW, Cedar Rapids, IA 52404 and is currently estimated at $176,966, approximately $119 per square foot. 2120 Chandler St SW is a home located in Linn County with nearby schools including Junction City Elementary School, Cleveland Elementary School, and Kentucky Tech - Ashland Reg Tech Center.
Ownership History
Date
Name
Owned For
Owner Type
Purchase Details
Closed on
Aug 5, 2003
Sold by
Hud
Bought by
Nehman Dawn Catherine and Nehman Dawn
Current Estimated Value
Home Financials for this Owner
Home Financials are based on the most recent Mortgage that was taken out on this home.
Original Mortgage
$72,000
Outstanding Balance
$31,359
Interest Rate
5.47%
Mortgage Type
Unknown
Estimated Equity
$145,607
Purchase Details
Closed on
Oct 23, 2002
Sold by
Countrywide Home Loans Inc
Bought by
Hud
Purchase Details
Closed on
Oct 22, 2002
Sold by
Weems Brandon A
Bought by
Countrywide Home Loans Inc
Purchase Details
Closed on
May 25, 1999
Sold by
Revocab Shedenhelm Thomas Lynn
Bought by
Weems Brandon A
Home Financials for this Owner
Home Financials are based on the most recent Mortgage that was taken out on this home.
Original Mortgage
$93,452
Interest Rate
6.92%
Mortgage Type
FHA
Create a Home Valuation Report for This Property
The Home Valuation Report is an in-depth analysis detailing your home's value as well as a comparison with similar homes in the area
Home Values in the Area
Average Home Value in this Area
Purchase History
| Date | Buyer | Sale Price | Title Company |
|---|---|---|---|
| Nehman Dawn Catherine | -- | First American Title | |
| Hud | -- | -- | |
| Countrywide Home Loans Inc | $100,234 | -- | |
| Weems Brandon A | $93,000 | -- | |
| Weems Brandon A | -- | -- |
Source: Public Records
Mortgage History
| Date | Status | Borrower | Loan Amount |
|---|---|---|---|
| Open | Nehman Dawn Catherine | $72,000 | |
| Previous Owner | Weems Brandon A | $93,452 |
Source: Public Records
Tax History Compared to Growth
Tax History
| Year | Tax Paid | Tax Assessment Tax Assessment Total Assessment is a certain percentage of the fair market value that is determined by local assessors to be the total taxable value of land and additions on the property. | Land | Improvement |
|---|---|---|---|---|
| 2025 | $2,158 | $169,500 | $28,800 | $140,700 |
| 2024 | $2,242 | $152,800 | $26,200 | $126,600 |
| 2023 | $2,242 | $132,400 | $26,200 | $106,200 |
| 2022 | $2,050 | $115,200 | $22,300 | $92,900 |
| 2021 | $2,102 | $107,900 | $22,300 | $85,600 |
| 2020 | $2,102 | $103,900 | $21,000 | $82,900 |
| 2019 | $1,870 | $95,300 | $21,000 | $74,300 |
| 2018 | $1,814 | $95,300 | $21,000 | $74,300 |
| 2017 | $2,191 | $93,900 | $21,000 | $72,900 |
| 2016 | $2,191 | $103,100 | $21,000 | $82,100 |
| 2015 | $2,213 | $104,040 | $20,952 | $83,088 |
| 2014 | $2,028 | $107,538 | $20,952 | $86,586 |
| 2013 | $2,054 | $107,538 | $20,952 | $86,586 |
Source: Public Records
Map
Nearby Homes
- 2437 9th Ave SW
- 2178 Chandler St SW
- 2433 8th Ave SW
- 1253 20th St SW
- 1832 8th Ave SW
- 1807 9th Ave SW
- 1206 18th St SW
- Remington - Cedar Rapids Plan at Whispering Pines
- Copeland Plan at Whispering Pines
- Meadowbrook - Cedar Rapids Plan at Stags Leap Estates
- Caldwell Plan at Stags Leap Estates
- Concord - Cedar Rapids Plan at Stags Leap Estates
- Yuma Expanded Plan at Whispering Pines
- Becker II Plan at Kirkwood Village - Kirk Wood Village
- Meadowbrook - Cedar Rapids Plan at Whispering Pines
- Richland Plan at Stags Leap Estates
- Prescott - Cedar Rapids Plan at Stags Leap Estates
- Becker Plan at Kirkwood Village - Kirk Wood Village
- Bakersfield - Cedar Rapids Plan at Whispering Pines
- Cedar Plan at Stags Leap Estates
- 2130 Chandler St SW
- 2110 Chandler St SW
- 2121 10th Ave SW
- 2138 Chandler St SW
- 2211 Williams Blvd SW
- 2142 Chandler St SW
- 2145 Williams Blvd SW
- 2137 Chandler St SW
- 2123 Chandler St SW
- 2117 Chandler St SW
- 2141 Chandler St SW
- 2219 Williams Blvd SW
- 2141 Williams Blvd SW
- 2146 Chandler St SW
- 2100 10th Ave SW
- 2111 Chandler St SW
- 1101 20th St SW
- 2225 Williams Blvd SW
- 2101 Chandler St SW
- 2135 Williams Blvd SW