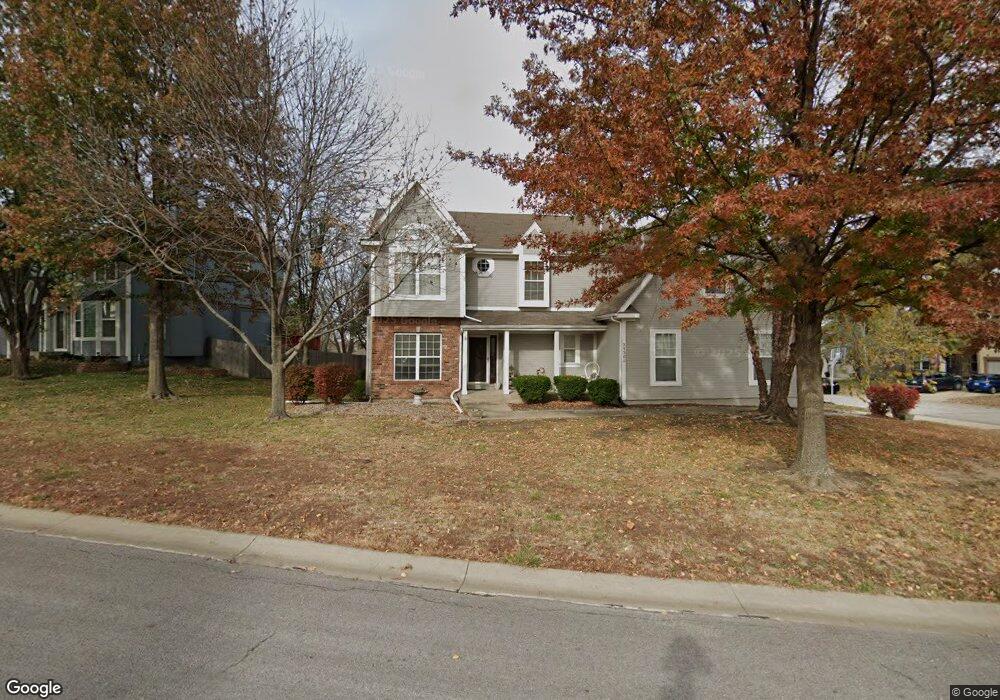
21204 W 48th St Shawnee, KS 66218
Estimated Value: $462,210 - $495,000
4
Beds
4
Baths
2,395
Sq Ft
$199/Sq Ft
Est. Value
About This Home
This home is located at 21204 W 48th St, Shawnee, KS 66218 and is currently estimated at $476,303, approximately $198 per square foot. 21204 W 48th St is a home located in Johnson County with nearby schools including Riverview Elementary School, Mill Creek Middle School, and Mill Valley High School.
Ownership History
Date
Name
Owned For
Owner Type
Purchase Details
Closed on
Dec 7, 2015
Sold by
Kaifes Melynda A and Kaifes Melynda A
Bought by
Kaifes Melynda and Kaifes K
Current Estimated Value
Home Financials for this Owner
Home Financials are based on the most recent Mortgage that was taken out on this home.
Original Mortgage
$199,542
Outstanding Balance
$156,949
Interest Rate
3.79%
Mortgage Type
New Conventional
Estimated Equity
$319,354
Purchase Details
Closed on
Jun 27, 2012
Sold by
Kaifes Eric
Bought by
Kaifes Melynda
Purchase Details
Closed on
Jun 10, 2004
Sold by
Nagel George W and Nagel Wanda S
Bought by
Kaifes Eric H and Kaifes Melynda A
Home Financials for this Owner
Home Financials are based on the most recent Mortgage that was taken out on this home.
Original Mortgage
$211,850
Interest Rate
6.12%
Mortgage Type
Purchase Money Mortgage
Create a Home Valuation Report for This Property
The Home Valuation Report is an in-depth analysis detailing your home's value as well as a comparison with similar homes in the area
Home Values in the Area
Average Home Value in this Area
Purchase History
| Date | Buyer | Sale Price | Title Company |
|---|---|---|---|
| Kaifes Melynda | -- | -- | |
| Kaifes Melynda | -- | None Available | |
| Kaifes Eric H | -- | Security Land Title Company |
Source: Public Records
Mortgage History
| Date | Status | Borrower | Loan Amount |
|---|---|---|---|
| Open | Kaifes Melynda | $199,542 | |
| Previous Owner | Kaifes Eric H | $211,850 |
Source: Public Records
Tax History Compared to Growth
Tax History
| Year | Tax Paid | Tax Assessment Tax Assessment Total Assessment is a certain percentage of the fair market value that is determined by local assessors to be the total taxable value of land and additions on the property. | Land | Improvement |
|---|---|---|---|---|
| 2024 | $5,556 | $47,794 | $9,942 | $37,852 |
| 2023 | $5,460 | $46,437 | $9,036 | $37,401 |
| 2022 | $5,115 | $42,619 | $8,210 | $34,409 |
| 2021 | $4,863 | $38,950 | $7,823 | $31,127 |
| 2020 | $4,352 | $34,523 | $6,519 | $28,004 |
| 2019 | $4,321 | $33,776 | $6,208 | $27,568 |
| 2018 | $4,078 | $31,591 | $6,209 | $25,382 |
| 2017 | $4,246 | $32,096 | $5,398 | $26,698 |
| 2016 | $4,108 | $30,671 | $4,911 | $25,760 |
| 2015 | $3,989 | $29,280 | $4,911 | $24,369 |
| 2013 | -- | $27,233 | $4,911 | $22,322 |
Source: Public Records
Map
Nearby Homes
- 21222 W 48th St
- 4754 Lakecrest Dr
- 21408 W 50th St
- 4713 Lone Elm
- 4531 Woodstock St
- 5015 Millbrook St
- 20823 W 45th Terrace
- 21525 W 51st St
- 22014 W 47th Terrace
- 22014 W 51st St
- 5116 Payne St
- 5311 Brownridge Dr
- 21804 W 52nd Terrace
- 5307 Noble St
- 5005 Hilltop Dr
- 5405 Lakecrest Dr
- 5206 Round Prairie St
- 22115 W 51st Terrace
- 21624 W 53rd Terrace
- 4638 Aminda St
- 21210 W 48th St
- 4766 Lakecrest Dr
- 21216 W 48th St
- 4812 Lakecrest Dr
- 4781 Lakecrest Dr
- 4775 Lakecrest Dr
- 4811 Marion St
- 4769 Lakecrest Dr
- 4761 Lakecrest Dr
- 4818 Lakecrest Dr
- 4815 Lakecrest Dr
- 21112 W 48th St
- 4804 Marion St
- 4757 Lakecrest Dr
- 4823 Marion St
- 4751 Lakecrest Dr
- 21228 W 48th St
- 4824 Lakecrest Dr
- 4821 Lakecrest Dr
- 4810 Marion St