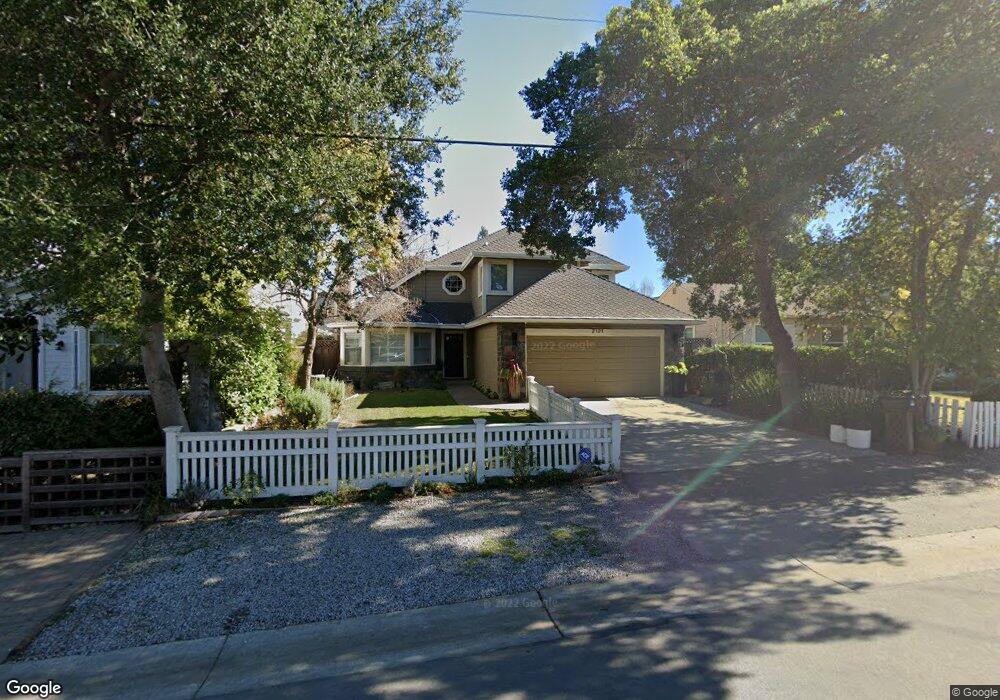
2121 Manzanita Ave Menlo Park, CA 94025
Central Menlo Park NeighborhoodEstimated Value: $3,390,000 - $3,962,000
4
Beds
3
Baths
2,360
Sq Ft
$1,539/Sq Ft
Est. Value
About This Home
This home is located at 2121 Manzanita Ave, Menlo Park, CA 94025 and is currently estimated at $3,633,104, approximately $1,539 per square foot. 2121 Manzanita Ave is a home located in San Mateo County with nearby schools including Las Lomitas Elementary School, La Entrada Middle School, and Menlo-Atherton High School.
Ownership History
Date
Name
Owned For
Owner Type
Purchase Details
Closed on
Mar 7, 2017
Sold by
Eberwein Kristin E
Bought by
Eberwein Kristin E
Current Estimated Value
Purchase Details
Closed on
Apr 4, 2014
Sold by
Eberwein William W and Eberwein Kristin Elise
Bought by
Eberwein William W and Eberwein Kristin E
Purchase Details
Closed on
Jun 23, 1998
Sold by
Kozlowski Jerome E
Bought by
Eberwein William W and Eberwein Kristin Elise
Home Financials for this Owner
Home Financials are based on the most recent Mortgage that was taken out on this home.
Original Mortgage
$290,000
Interest Rate
7.25%
Purchase Details
Closed on
Aug 9, 1996
Sold by
Eberwein William W and Eberwein Kreistin Elise
Bought by
Eberwein William W and Eberwein Kristin Elise
Home Financials for this Owner
Home Financials are based on the most recent Mortgage that was taken out on this home.
Original Mortgage
$295,000
Interest Rate
7.62%
Create a Home Valuation Report for This Property
The Home Valuation Report is an in-depth analysis detailing your home's value as well as a comparison with similar homes in the area
Home Values in the Area
Average Home Value in this Area
Purchase History
| Date | Buyer | Sale Price | Title Company |
|---|---|---|---|
| Eberwein Kristin E | -- | None Available | |
| Eberwein William W | -- | None Available | |
| Eberwein William W | -- | Old Republic Title Ins Compa | |
| Eberwein William W | -- | -- | |
| Eberwein William W | $745,000 | North American Title Co |
Source: Public Records
Mortgage History
| Date | Status | Borrower | Loan Amount |
|---|---|---|---|
| Previous Owner | Eberwein William W | $290,000 | |
| Previous Owner | Eberwein William W | $295,000 |
Source: Public Records
Tax History Compared to Growth
Tax History
| Year | Tax Paid | Tax Assessment Tax Assessment Total Assessment is a certain percentage of the fair market value that is determined by local assessors to be the total taxable value of land and additions on the property. | Land | Improvement |
|---|---|---|---|---|
| 2025 | $14,760 | $1,213,360 | $606,680 | $606,680 |
| 2023 | $14,760 | $1,166,246 | $583,123 | $583,123 |
| 2022 | $14,111 | $1,143,380 | $571,690 | $571,690 |
| 2021 | $13,888 | $1,120,962 | $560,481 | $560,481 |
| 2020 | $13,583 | $1,109,468 | $554,734 | $554,734 |
| 2019 | $13,932 | $1,087,714 | $543,857 | $543,857 |
| 2018 | $13,276 | $1,066,388 | $533,194 | $533,194 |
| 2017 | $12,826 | $1,045,480 | $522,740 | $522,740 |
| 2016 | $12,701 | $1,024,982 | $512,491 | $512,491 |
| 2015 | $12,435 | $1,009,586 | $504,793 | $504,793 |
| 2014 | $12,284 | $989,810 | $494,905 | $494,905 |
Source: Public Records
Map
Nearby Homes
- 2140 Monterey Ave
- 399 Camino al Lago
- 1360 Trinity Dr
- 2 Hallmark Cir
- 1350 Trinity Dr
- 15 San Juan Ave
- 89 Tallwood Ct
- 1265 Trinity Dr
- 93 Broadacres Rd
- 2 Callado Way
- 1410 Franks Ln
- 261 Camino al Lago
- 1 Tallwood Ct
- 57 Fairview Ave
- 2051 Gordon Ave
- 2138 Avy Ave
- 83 & 93 Camino Por Los Arboles
- 291 Atherton Ave
- 93 Camino Por Los Arboles
- 83 Camino Por Los Arboles
- 2131 Manzanita Ave
- 2111 Manzanita Ave
- 2141 Manzanita Ave
- 2107 Manzanita Ave
- 2120 Monterey Ave
- 2130 Monterey Ave
- 2110 Monterey Ave
- 2151 Manzanita Ave
- 2108 Monterey Ave
- 3126 Alameda de Las Pulgas
- 2101 Manzanita Ave
- 2110 Manzanita Ave
- 2120 Manzanita Ave
- 3134 Alameda de Las Pulgas
- 2150 Monterey Ave
- 2108 Manzanita Ave
- 2161 Manzanita Ave
- 2104 Manzanita Ave
- 3138 Alameda de Las Pulgas
- 2140 Manzanita Ave