2121 Sol St San Leandro, CA 94578
Bay-O-Vista NeighborhoodEstimated Value: $667,000 - $742,000
2
Beds
2
Baths
1,124
Sq Ft
$626/Sq Ft
Est. Value
About This Home
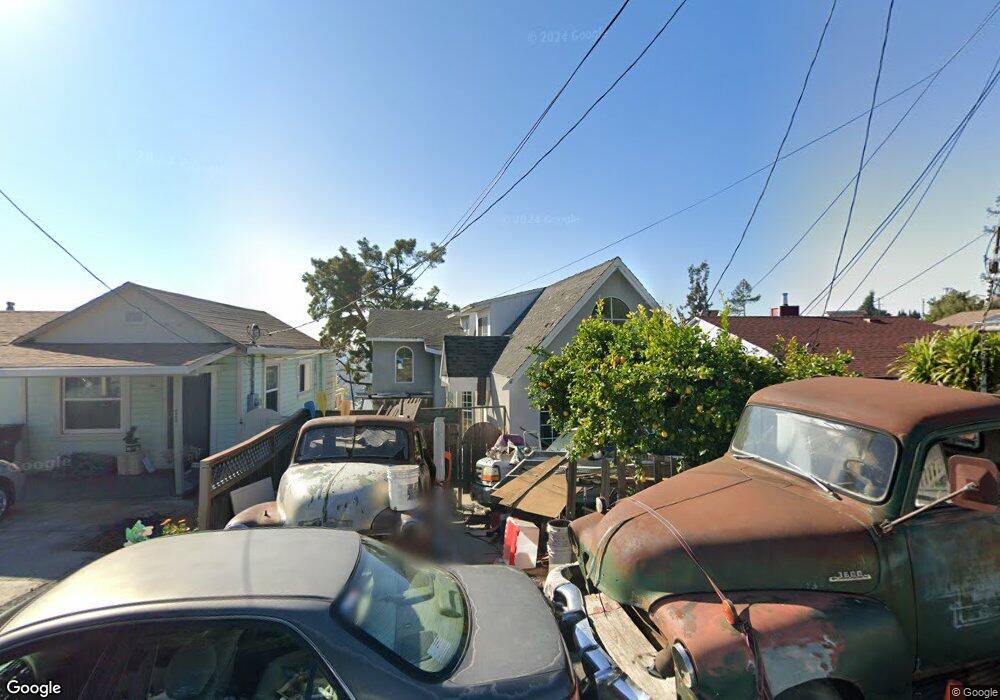
This home is located at 2121 Sol St, San Leandro, CA 94578 and is currently estimated at $703,727, approximately $626 per square foot. 2121 Sol St is a home located in Alameda County with nearby schools including Corvallis Elementary School, Edendale Middle, and San Lorenzo High School.
Ownership History
Date
Name
Owned For
Owner Type
Purchase Details
Closed on
Aug 12, 1993
Sold by
Andresen Rita Therese
Bought by
Andresen Mark Hinton
Current Estimated Value
Home Financials for this Owner
Home Financials are based on the most recent Mortgage that was taken out on this home.
Original Mortgage
$26,000
Interest Rate
6.94%
Create a Home Valuation Report for This Property
The Home Valuation Report is an in-depth analysis detailing your home's value as well as a comparison with similar homes in the area
Home Values in the Area
Average Home Value in this Area
Purchase History
| Date | Buyer | Sale Price | Title Company |
|---|---|---|---|
| Andresen Mark Hinton | -- | Old Republic Title Co |
Source: Public Records
Mortgage History
| Date | Status | Borrower | Loan Amount |
|---|---|---|---|
| Previous Owner | Andresen Mark Hinton | $26,000 |
Source: Public Records
Tax History
| Year | Tax Paid | Tax Assessment Tax Assessment Total Assessment is a certain percentage of the fair market value that is determined by local assessors to be the total taxable value of land and additions on the property. | Land | Improvement |
|---|---|---|---|---|
| 2025 | $4,087 | $219,048 | $108,218 | $117,830 |
| 2024 | $4,087 | $214,616 | $106,096 | $115,520 |
| 2023 | $3,943 | $217,271 | $104,016 | $113,255 |
| 2022 | $3,862 | $206,011 | $101,977 | $111,034 |
| 2021 | $3,755 | $203,236 | $99,978 | $108,858 |
| 2020 | $3,716 | $206,695 | $98,953 | $107,742 |
| 2019 | $3,782 | $202,643 | $97,013 | $105,630 |
| 2018 | $3,252 | $198,670 | $95,111 | $103,559 |
| 2017 | $3,127 | $194,775 | $93,246 | $101,529 |
| 2016 | $3,085 | $190,957 | $91,418 | $99,539 |
| 2015 | $3,011 | $188,089 | $90,045 | $98,044 |
| 2014 | $2,931 | $184,405 | $88,282 | $96,123 |
Source: Public Records
Map
Nearby Homes
- 2245 Sol St
- 0 Saturn Dr
- 14670 Midland Rd
- 14644 Saturn Dr
- 14831 Bancroft Ave Unit Space 27
- 15675 Liberty St
- 1592 Oriole Ave
- 1269 Gabriel Ct
- 15065 Hesperian Blvd Unit 22
- 15933 Cambrian Dr
- 1521 159th Ave
- 1410 Thrush Ave Unit 3
- 0 Montrose Dr
- 14240 Rose Dr
- 16006 E 14th St Unit 101
- 475 Nabor St
- 1672 162nd Ave
- 0 Lindview Dr
- 1550 162nd Ave Unit 69
- 1550 162nd Ave Unit 47
Your Personal Tour Guide
Ask me questions while you tour the home.