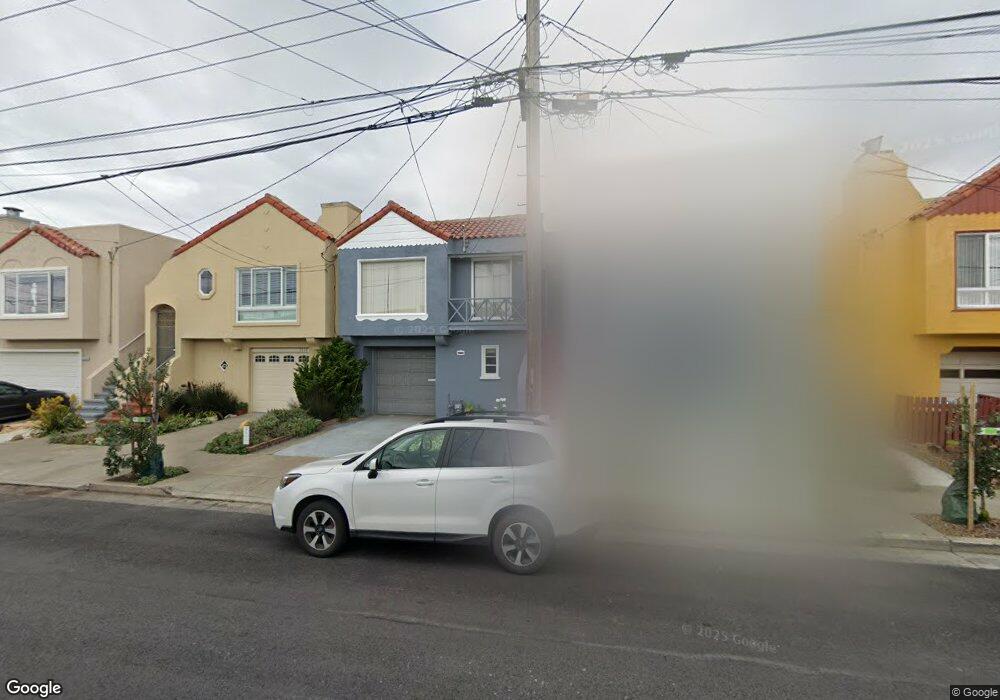
2122 47th Ave San Francisco, CA 94116
Outer Parkside NeighborhoodEstimated Value: $1,001,000 - $1,566,000
2
Beds
1
Bath
1,250
Sq Ft
$1,080/Sq Ft
Est. Value
About This Home
This home is located at 2122 47th Ave, San Francisco, CA 94116 and is currently estimated at $1,350,600, approximately $1,080 per square foot. 2122 47th Ave is a home located in San Francisco County with nearby schools including Sunset Elementary School, Giannini (A.P.) Middle School, and St. Gabriel School.
Ownership History
Date
Name
Owned For
Owner Type
Purchase Details
Closed on
Sep 14, 2010
Sold by
Kim Soo Duk
Bought by
Bogdanova Lana and Bogdanov Valeriy
Current Estimated Value
Home Financials for this Owner
Home Financials are based on the most recent Mortgage that was taken out on this home.
Original Mortgage
$327,000
Outstanding Balance
$216,038
Interest Rate
4.45%
Mortgage Type
New Conventional
Estimated Equity
$1,134,562
Purchase Details
Closed on
Sep 5, 2001
Sold by
Park Kenneth K and Park Helen H
Bought by
Park Kenneth K and Park Helen H
Purchase Details
Closed on
Dec 21, 1995
Sold by
Kim Young Oak Choi
Bought by
Kim Soo Duk and Kim Jung Ja
Home Financials for this Owner
Home Financials are based on the most recent Mortgage that was taken out on this home.
Original Mortgage
$171,200
Interest Rate
7.36%
Create a Home Valuation Report for This Property
The Home Valuation Report is an in-depth analysis detailing your home's value as well as a comparison with similar homes in the area
Home Values in the Area
Average Home Value in this Area
Purchase History
| Date | Buyer | Sale Price | Title Company |
|---|---|---|---|
| Bogdanova Lana | $577,500 | Cornerstone Title Company | |
| Kim Soo Duk | -- | Cornerstone Title Company | |
| Park Kenneth K | -- | -- | |
| Kim Soo Duk | $214,000 | Fidelity National Title Ins |
Source: Public Records
Mortgage History
| Date | Status | Borrower | Loan Amount |
|---|---|---|---|
| Open | Bogdanova Lana | $327,000 | |
| Previous Owner | Kim Soo Duk | $171,200 |
Source: Public Records
Tax History Compared to Growth
Tax History
| Year | Tax Paid | Tax Assessment Tax Assessment Total Assessment is a certain percentage of the fair market value that is determined by local assessors to be the total taxable value of land and additions on the property. | Land | Improvement |
|---|---|---|---|---|
| 2025 | $9,204 | $739,810 | $517,880 | $221,930 |
| 2024 | $9,204 | $725,308 | $507,728 | $217,580 |
| 2023 | $9,058 | $711,088 | $497,774 | $213,314 |
| 2022 | $8,875 | $697,148 | $488,016 | $209,132 |
| 2021 | $8,713 | $683,484 | $478,450 | $205,034 |
| 2020 | $8,764 | $676,480 | $473,546 | $202,934 |
| 2019 | $8,465 | $663,218 | $464,262 | $198,956 |
| 2018 | $8,178 | $650,088 | $455,070 | $195,018 |
| 2017 | $7,781 | $637,346 | $446,150 | $191,196 |
| 2016 | $7,638 | $624,854 | $437,404 | $187,450 |
| 2015 | $7,541 | $615,472 | $430,836 | $184,636 |
| 2014 | $7,342 | $603,420 | $422,398 | $181,022 |
Source: Public Records
Map
Nearby Homes
- 3622 Rivera St
- 2026 Great Hwy
- 2262 47th Ave
- 2142 43rd Ave
- 2170 43rd Ave
- 3917 Noriega St
- 1746 47th Ave
- 4229 Moraga St
- 1862 40th Ave
- 4108 Moraga St Unit 4110
- 1783 40th Ave
- 3400 Vicente St
- 1834 38th Ave
- 1580 Great Hwy Unit 4
- 1586 44th Ave
- 1775 37th Ave
- 1538 48th Ave
- 2675 45th Ave
- 1563 43rd Ave
- 2687 45th Ave