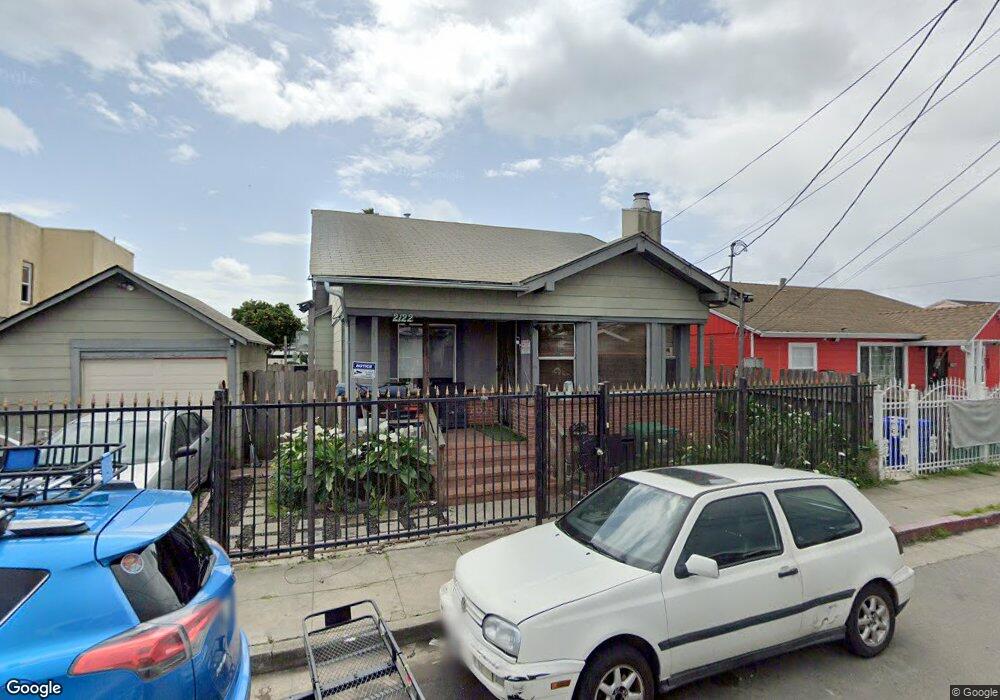
2122 Grant Ave Richmond, CA 94801
Belding Woods NeighborhoodEstimated Value: $397,000 - $442,000
1
Bed
1
Bath
856
Sq Ft
$493/Sq Ft
Est. Value
About This Home
This home is located at 2122 Grant Ave, Richmond, CA 94801 and is currently estimated at $422,017, approximately $493 per square foot. 2122 Grant Ave is a home located in Contra Costa County with nearby schools including Grant Elementary School, Lovonya DeJean Middle School, and John F. Kennedy High School.
Ownership History
Date
Name
Owned For
Owner Type
Purchase Details
Closed on
Mar 21, 2012
Sold by
Fung Johnny Ming Kan
Bought by
Lin Bin and Ma Hong
Current Estimated Value
Purchase Details
Closed on
Mar 11, 2011
Sold by
Hacienda At 12625 High Bluff Drive Llc
Bought by
Fung Johnny Ming Kan
Purchase Details
Closed on
Jan 13, 2011
Sold by
Ramos Jose J and Ramos Angelina
Bought by
Kleege Robert Bruce and Kleege Brenda
Purchase Details
Closed on
Jun 15, 2004
Sold by
Ponce Jesus and Cuiriz Imelda
Bought by
Ramos Jose J and Ramos Angelina
Home Financials for this Owner
Home Financials are based on the most recent Mortgage that was taken out on this home.
Original Mortgage
$210,400
Interest Rate
7.87%
Mortgage Type
Purchase Money Mortgage
Purchase Details
Closed on
Jun 11, 1998
Sold by
Russey Walter E and Russey Janette P
Bought by
Ponce Jesus and Cuiriz Imelda
Home Financials for this Owner
Home Financials are based on the most recent Mortgage that was taken out on this home.
Original Mortgage
$94,683
Interest Rate
7.06%
Mortgage Type
FHA
Create a Home Valuation Report for This Property
The Home Valuation Report is an in-depth analysis detailing your home's value as well as a comparison with similar homes in the area
Home Values in the Area
Average Home Value in this Area
Purchase History
| Date | Buyer | Sale Price | Title Company |
|---|---|---|---|
| Lin Bin | $90,000 | Chicago Title Company | |
| Fung Johnny Ming Kan | $71,000 | Chicago Title Company | |
| Kleege Robert Bruce | $48,500 | Stewart Title Of California | |
| Ramos Jose J | $268,000 | Old Republic Title | |
| Ponce Jesus | $94,000 | Old Republic Title Company |
Source: Public Records
Mortgage History
| Date | Status | Borrower | Loan Amount |
|---|---|---|---|
| Previous Owner | Ramos Jose J | $210,400 | |
| Previous Owner | Ponce Jesus | $94,683 | |
| Closed | Ramos Jose J | $39,450 |
Source: Public Records
Tax History
| Year | Tax Paid | Tax Assessment Tax Assessment Total Assessment is a certain percentage of the fair market value that is determined by local assessors to be the total taxable value of land and additions on the property. | Land | Improvement |
|---|---|---|---|---|
| 2025 | $3,087 | $113,031 | $50,235 | $62,796 |
| 2024 | $3,020 | $110,815 | $49,250 | $61,565 |
| 2023 | $3,020 | $108,643 | $48,285 | $60,358 |
| 2022 | $2,930 | $106,514 | $47,339 | $59,175 |
| 2021 | $2,859 | $104,426 | $46,411 | $58,015 |
| 2019 | $2,673 | $101,332 | $45,036 | $56,296 |
| 2018 | $2,570 | $99,346 | $44,153 | $55,193 |
| 2017 | $2,492 | $97,399 | $43,288 | $54,111 |
| 2016 | $2,426 | $95,490 | $42,440 | $53,050 |
| 2015 | $2,383 | $94,057 | $41,803 | $52,254 |
| 2014 | $2,369 | $92,216 | $40,985 | $51,231 |
Source: Public Records
Map
Nearby Homes
- 649 23rd St
- 653 20th St
- 569 18th St
- 1827 Barrett Ave
- 2366 Gaynor Ave
- 559 Civic Center St
- 621 16th St
- 1929 Lincoln Ave
- 2417 Esmond Ave
- 2555 Barrett Ave
- 2103 Visalia Ave
- 421 Metro Walk Way
- 2009 Coalinga Ave
- 2110 Hellings Ave
- 626 28th St
- 1411 Nevin Plaza
- 630 12th St
- 444 28th St
- 1741 Hellings Ave
- 640 11th St
Your Personal Tour Guide
Ask me questions while you tour the home.