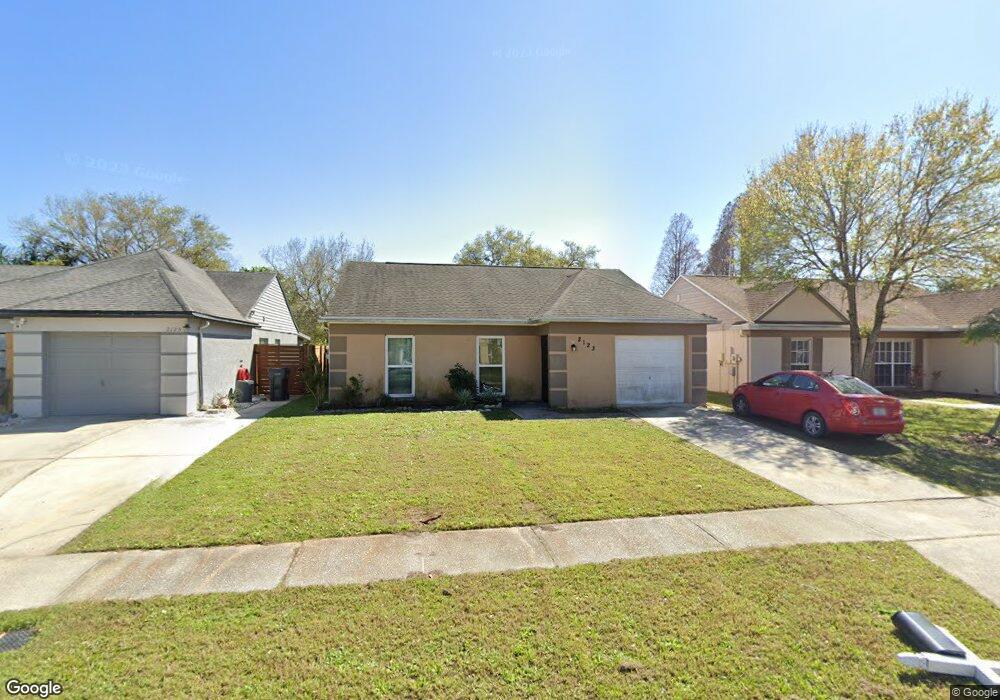
2123 Redleaf Dr Unit 1 Brandon, FL 33510
Estimated Value: $266,124 - $298,000
2
Beds
2
Baths
1,062
Sq Ft
$263/Sq Ft
Est. Value
About This Home
This home is located at 2123 Redleaf Dr Unit 1, Brandon, FL 33510 and is currently estimated at $279,281, approximately $262 per square foot. 2123 Redleaf Dr Unit 1 is a home located in Hillsborough County with nearby schools including Colson Elementary School, Mann Middle School, and Armwood High School.
Ownership History
Date
Name
Owned For
Owner Type
Purchase Details
Closed on
Nov 15, 2019
Sold by
Mendizabal Juan Manuel and Mendizabal Loida
Bought by
Mendizabal Juan Manuel and Mendizabal Loida
Current Estimated Value
Home Financials for this Owner
Home Financials are based on the most recent Mortgage that was taken out on this home.
Original Mortgage
$126,000
Outstanding Balance
$109,882
Interest Rate
3.6%
Mortgage Type
New Conventional
Estimated Equity
$169,399
Purchase Details
Closed on
Apr 1, 2011
Sold by
Izquierido Iluminada Alicea
Bought by
Resto Flavia
Purchase Details
Closed on
Jun 13, 2003
Sold by
Baccamazzi Marsha J
Bought by
Izquierido Iluminada Alicea
Purchase Details
Closed on
Apr 29, 1996
Sold by
Sec Of Hud
Bought by
Baccamazzi Marsha J
Home Financials for this Owner
Home Financials are based on the most recent Mortgage that was taken out on this home.
Original Mortgage
$53,000
Interest Rate
7.8%
Mortgage Type
New Conventional
Create a Home Valuation Report for This Property
The Home Valuation Report is an in-depth analysis detailing your home's value as well as a comparison with similar homes in the area
Home Values in the Area
Average Home Value in this Area
Purchase History
| Date | Buyer | Sale Price | Title Company |
|---|---|---|---|
| Mendizabal Juan Manuel | -- | Attorney | |
| Resto Flavia | $47,700 | Executive Title Of Fl Inc | |
| Izquierido Iluminada Alicea | $92,000 | First American Title Ins Co | |
| Baccamazzi Marsha J | $53,000 | -- |
Source: Public Records
Mortgage History
| Date | Status | Borrower | Loan Amount |
|---|---|---|---|
| Open | Mendizabal Juan Manuel | $126,000 | |
| Previous Owner | Baccamazzi Marsha J | $53,000 |
Source: Public Records
Tax History
| Year | Tax Paid | Tax Assessment Tax Assessment Total Assessment is a certain percentage of the fair market value that is determined by local assessors to be the total taxable value of land and additions on the property. | Land | Improvement |
|---|---|---|---|---|
| 2025 | $3,649 | $191,392 | $59,202 | $132,190 |
| 2024 | $3,649 | $191,392 | $59,202 | $132,190 |
| 2023 | $3,407 | $186,253 | $59,202 | $127,051 |
| 2022 | $3,133 | $181,319 | $49,335 | $131,984 |
| 2021 | $2,726 | $128,257 | $36,179 | $92,078 |
| 2020 | $2,485 | $118,786 | $32,890 | $85,896 |
| 2019 | $2,303 | $115,128 | $32,890 | $82,238 |
| 2018 | $2,160 | $106,052 | $0 | $0 |
| 2017 | $1,995 | $94,454 | $0 | $0 |
| 2016 | $1,801 | $78,465 | $0 | $0 |
| 2015 | $1,709 | $71,920 | $0 | $0 |
| 2014 | $1,575 | $65,382 | $0 | $0 |
| 2013 | -- | $58,794 | $0 | $0 |
Source: Public Records
Map
Nearby Homes
- 2110 Shady Point Ln
- 1657 Palm Leaf Dr
- 1628 Curry St
- 3808 Broad St
- 2318 Hibiscus Ave
- 11433 Weldon St
- 1952 Fruitridge St
- 2070 Sarah Louise Dr
- 1933 Fruitridge St
- 1707 Jillian Rd
- 1535 Thistledown Dr
- 4007 Truman Dr
- 11230 Taft Ln
- 1113 Vinetree Dr
- 3403 High Hampton Cir
- 321 Orange Ln Unit 253
- 130 Palmetto Terrace Unit 281
- 209 Birch Ln Unit 17
- 221 Cherry Ln Unit 63
- 210 Birch Ln Unit 18
- 2123 Redleaf Dr Unit I
- 2125 Redleaf Dr
- 2121 Redleaf Dr
- 2127 Redleaf Dr
- 2119 Redleaf Dr
- 2117 Redleaf Dr
- 2129 Redleaf Dr
- 2130 Redleaf Dr
- 1687 Palm Leaf Dr
- 1687 Palm Leaf Dr Unit 1
- 2132 Redleaf Dr
- 2128 Redleaf Dr
- 2134 Redleaf Dr
- 2126 Redleaf Dr
- 2131 Redleaf Dr
- 2124 Redleaf Dr
- 2136 Redleaf Dr
- 2115 Redleaf Dr
- 1685 Palm Leaf Dr
- 2138 Redleaf Dr
Your Personal Tour Guide
Ask me questions while you tour the home.