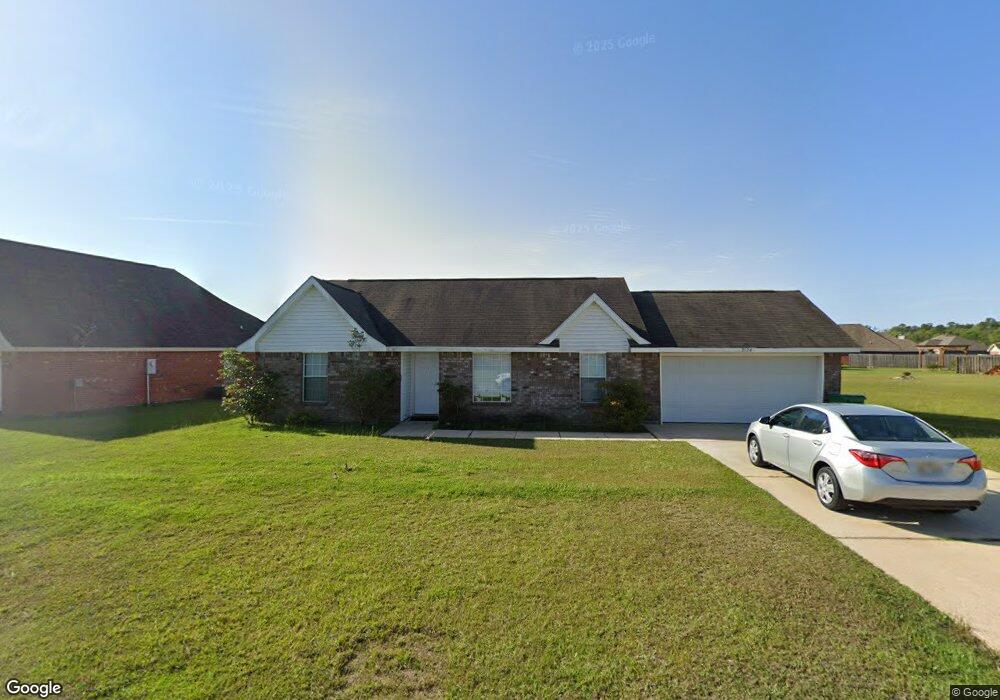
2124 Irma Cir Unit LOT 212 Ocean Springs, MS 39564
Estimated Value: $187,000 - $233,000
3
Beds
2
Baths
1,123
Sq Ft
$181/Sq Ft
Est. Value
About This Home
This home is located at 2124 Irma Cir Unit LOT 212, Ocean Springs, MS 39564 and is currently estimated at $203,626, approximately $181 per square foot. 2124 Irma Cir Unit LOT 212 is a home located in Jackson County with nearby schools including St Martin East Elementary School, St Martin North Elementary School, and St Martin Upper Elementary School.
Ownership History
Date
Name
Owned For
Owner Type
Purchase Details
Closed on
Sep 23, 2024
Sold by
Magruder Noah
Bought by
Duffy Conner
Current Estimated Value
Home Financials for this Owner
Home Financials are based on the most recent Mortgage that was taken out on this home.
Original Mortgage
$200,214
Outstanding Balance
$197,959
Interest Rate
6.46%
Mortgage Type
VA
Estimated Equity
$5,667
Purchase Details
Closed on
Dec 28, 2021
Sold by
Diaddezio Llc
Bought by
Magruder Noah
Home Financials for this Owner
Home Financials are based on the most recent Mortgage that was taken out on this home.
Original Mortgage
$163,577
Interest Rate
3.05%
Mortgage Type
FHA
Purchase Details
Closed on
Oct 12, 2009
Sold by
American Pension Services Inc
Bought by
Diaddizio Llc
Create a Home Valuation Report for This Property
The Home Valuation Report is an in-depth analysis detailing your home's value as well as a comparison with similar homes in the area
Home Values in the Area
Average Home Value in this Area
Purchase History
| Date | Buyer | Sale Price | Title Company |
|---|---|---|---|
| Duffy Conner | -- | None Listed On Document | |
| Magruder Noah | -- | None Available | |
| Diaddizio Llc | -- | -- |
Source: Public Records
Mortgage History
| Date | Status | Borrower | Loan Amount |
|---|---|---|---|
| Open | Duffy Conner | $200,214 | |
| Previous Owner | Magruder Noah | $163,577 |
Source: Public Records
Tax History Compared to Growth
Tax History
| Year | Tax Paid | Tax Assessment Tax Assessment Total Assessment is a certain percentage of the fair market value that is determined by local assessors to be the total taxable value of land and additions on the property. | Land | Improvement |
|---|---|---|---|---|
| 2024 | $1,275 | $10,465 | $2,703 | $7,762 |
| 2023 | $1,275 | $10,465 | $2,703 | $7,762 |
| 2022 | $1,241 | $10,465 | $2,703 | $7,762 |
| 2021 | $1,875 | $15,809 | $4,055 | $11,754 |
| 2020 | $1,841 | $14,946 | $3,861 | $11,085 |
| 2019 | $1,822 | $14,946 | $3,861 | $11,085 |
| 2018 | $1,857 | $14,946 | $3,861 | $11,085 |
| 2017 | $1,888 | $14,946 | $3,861 | $11,085 |
| 2016 | $1,814 | $14,946 | $3,861 | $11,085 |
| 2015 | $1,768 | $96,540 | $25,740 | $70,800 |
| 2014 | $1,779 | $14,825 | $3,861 | $10,964 |
| 2013 | $1,721 | $14,825 | $3,861 | $10,964 |
Source: Public Records
Map
Nearby Homes
- 2125 Magazine St
- 2205 Magazine St
- 2113 Toulouse St
- 2409 Esplanade St
- 2325 Rhonda Ave
- Sycamore IV G Plan at Scarlett Glen
- Hickory III H Plan at Scarlett Glen
- Hickory III G Plan at Scarlett Glen
- Comstock III H Plan at Scarlett Glen
- Comstock III G Plan at Scarlett Glen
- Camellia V H Plan at Scarlett Glen
- Camellia V G Plan at Scarlett Glen
- Falkner III G Plan at Scarlett Glen
- Rodessa IV H Plan at Scarlett Glen
- Rodessa IV G Plan at Scarlett Glen
- Roses V H Plan at Scarlett Glen
- Roses V G Plan at Scarlett Glen
- Oakstone V H Plan at Scarlett Glen
- Oakstone V G Plan at Scarlett Glen
- Yucca III G Plan at Scarlett Glen