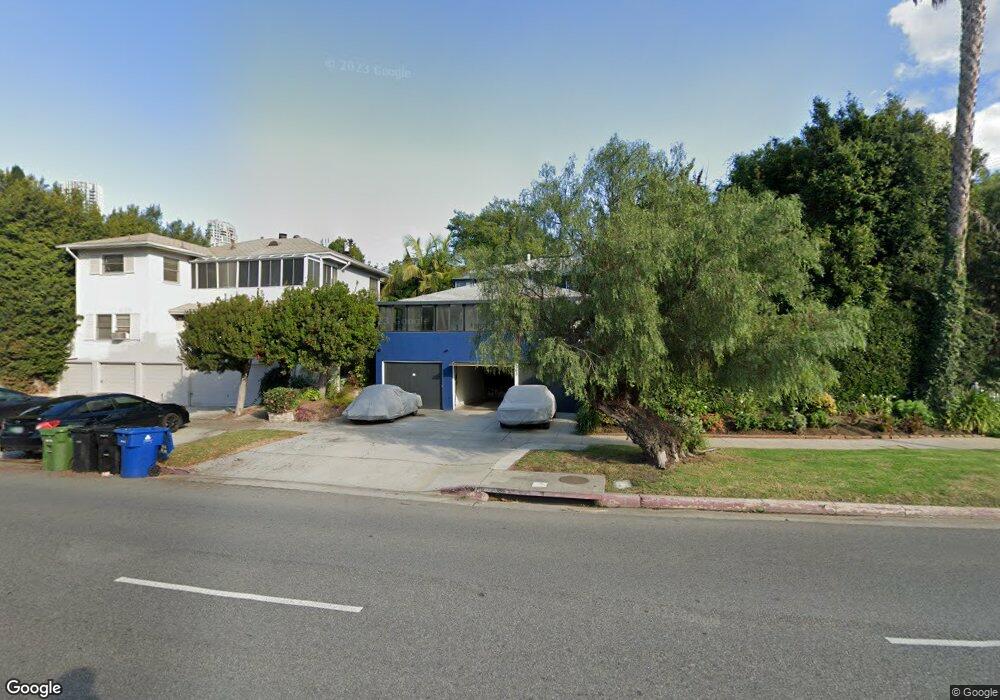
2124 S Beverly Glen Blvd Los Angeles, CA 90025
Estimated Value: $1,402,000 - $2,568,000
5
Beds
3
Baths
3,258
Sq Ft
$625/Sq Ft
Est. Value
About This Home
This home is located at 2124 S Beverly Glen Blvd, Los Angeles, CA 90025 and is currently estimated at $2,037,356, approximately $625 per square foot. 2124 S Beverly Glen Blvd is a home located in Los Angeles County with nearby schools including Daniel Webster Middle School, Westwood Charter School, and Ralph Waldo Emerson Community Charter Middle School.
Ownership History
Date
Name
Owned For
Owner Type
Purchase Details
Closed on
Aug 29, 1998
Sold by
Asowitch Harry
Bought by
Asowitch Anne
Current Estimated Value
Home Financials for this Owner
Home Financials are based on the most recent Mortgage that was taken out on this home.
Original Mortgage
$457,500
Outstanding Balance
$97,983
Interest Rate
6.93%
Mortgage Type
Purchase Money Mortgage
Estimated Equity
$1,939,373
Purchase Details
Closed on
Jun 3, 1996
Sold by
Harel Ron
Bought by
Harel Gil and Harel Iris
Purchase Details
Closed on
Feb 21, 1995
Sold by
Simpson Sarah Gertrude and The Sarah Gertrude Simpson 199
Bought by
Harel Gil and Harel Iris
Home Financials for this Owner
Home Financials are based on the most recent Mortgage that was taken out on this home.
Original Mortgage
$324,800
Interest Rate
9.23%
Create a Home Valuation Report for This Property
The Home Valuation Report is an in-depth analysis detailing your home's value as well as a comparison with similar homes in the area
Home Values in the Area
Average Home Value in this Area
Purchase History
| Date | Buyer | Sale Price | Title Company |
|---|---|---|---|
| Asowitch Anne | -- | Investors Title Company | |
| Harel Gil | -- | Old Republic Title Company | |
| Harel Gil | $406,000 | Old Republic Title |
Source: Public Records
Mortgage History
| Date | Status | Borrower | Loan Amount |
|---|---|---|---|
| Open | Asowitch Anne | $457,500 | |
| Previous Owner | Harel Gil | $324,800 | |
| Closed | Harel Gil | $40,600 |
Source: Public Records
Tax History Compared to Growth
Tax History
| Year | Tax Paid | Tax Assessment Tax Assessment Total Assessment is a certain percentage of the fair market value that is determined by local assessors to be the total taxable value of land and additions on the property. | Land | Improvement |
|---|---|---|---|---|
| 2025 | $8,518 | $681,933 | $503,901 | $178,032 |
| 2024 | $8,518 | $668,563 | $494,021 | $174,542 |
| 2023 | $8,363 | $655,455 | $484,335 | $171,120 |
| 2022 | $7,988 | $642,604 | $474,839 | $167,765 |
| 2021 | $7,875 | $630,005 | $465,529 | $164,476 |
| 2019 | $7,646 | $611,321 | $451,722 | $159,599 |
| 2018 | $7,578 | $599,335 | $442,865 | $156,470 |
| 2016 | $7,227 | $576,064 | $425,669 | $150,395 |
| 2015 | $7,124 | $567,412 | $419,276 | $148,136 |
| 2014 | $7,166 | $556,298 | $411,063 | $145,235 |
Source: Public Records
Map
Nearby Homes
- 2175 S Beverly Glen Blvd Unit 403
- 2157 Linnington Ave
- 2010 S Beverly Glen Blvd Unit 302
- 2240 S Beverly Glen Blvd Unit 103
- 1944 S Beverly Glen Blvd
- 1940 S Beverly Glen Blvd
- 10326 Keswick Ave
- 10320 Mississippi Ave
- 1912 Benecia Ave
- 2301 S Beverly Glen Blvd Unit 102
- 1920 Pandora Ave Unit 3
- 1925 S Beverly Glen Blvd Unit 37
- 1925 S Beverly Glen Blvd Unit 30
- 1937 S Beverly Glen Blvd Unit 47
- 2323 S Beverly Glen Blvd Unit 9
- 10365 Ilona Ave
- 10301 Mississippi Ave
- 10404 Ilona Ave Unit 2
- 1875 S Beverly Glen Blvd Unit 106
- 2187 Century Woods Way Unit 33
- 2122 S Beverly Glen Blvd
- 2148 S Beverly Glen Blvd
- 2131 Benecia Ave
- 2127 Benecia Ave
- 2121 Benecia Ave
- 2137 Benecia Ave
- 2141 Benecia Ave
- 2115 Benecia Ave
- 2108 S Beverly Glen Blvd
- 2180 S Bev Glen Blvd Unit 124
- 2180 S Bev Glen Blvd Unit 123
- 2180 S Bev Glen Blvd Unit 122
- 2180 S Bev Glen Blvd Unit 121
- 2180 S Bev Glen Blvd Unit 120
- 2180 S Bev Glen Blvd Unit 119
- 2180 S Bev Glen Blvd Unit 118
- 2180 S Bev Glen Blvd Unit 117
- 2180 S Bev Glen Blvd Unit 372
- 2180 S Bev Glen Blvd Unit 371
- 2180 S Bev Glen Blvd Unit 370