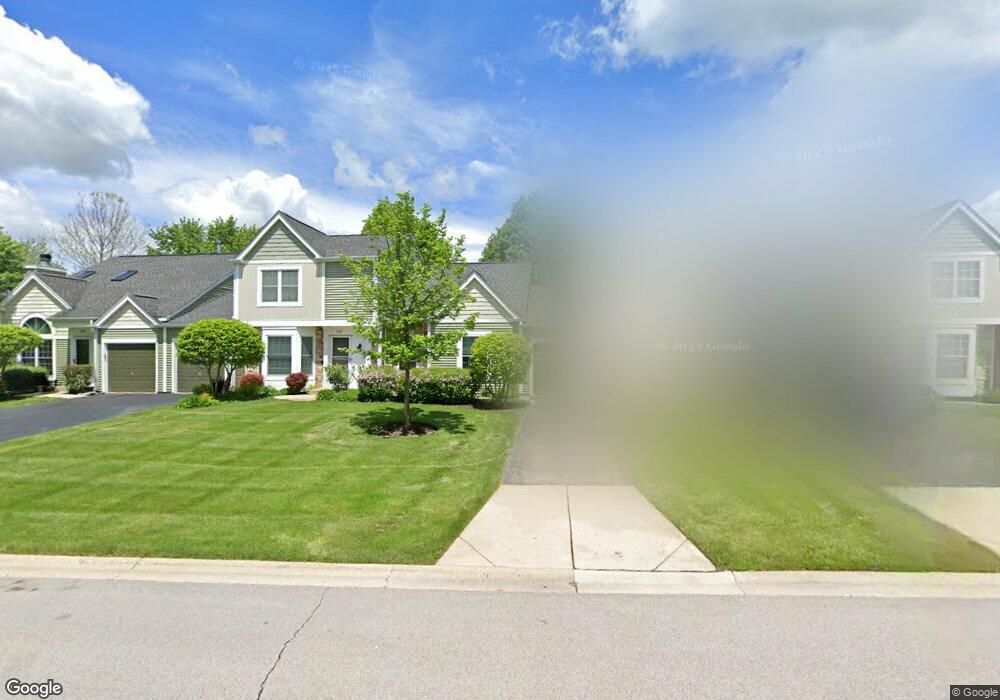
2124 Teton Pkwy Unit 1 Algonquin, IL 60102
Estimated Value: $224,000 - $268,000
1
Bed
2
Baths
979
Sq Ft
$251/Sq Ft
Est. Value
About This Home
This home is located at 2124 Teton Pkwy Unit 1, Algonquin, IL 60102 and is currently estimated at $245,442, approximately $250 per square foot. 2124 Teton Pkwy Unit 1 is a home located in McHenry County with nearby schools including Algonquin Lakes Elementary School, Algonquin Middle School, and Dundee-Crown High School.
Ownership History
Date
Name
Owned For
Owner Type
Purchase Details
Closed on
Oct 18, 2024
Sold by
Just Keith
Bought by
Just Keith and Wilcox Deborah Ann
Current Estimated Value
Purchase Details
Closed on
May 1, 2015
Sold by
Wilcox Deborah
Bought by
Just Keith
Purchase Details
Closed on
Oct 15, 2003
Sold by
Gonzalez Daniel
Bought by
Just Keith E and Wilcox Deborah A
Home Financials for this Owner
Home Financials are based on the most recent Mortgage that was taken out on this home.
Original Mortgage
$130,945
Interest Rate
5.81%
Mortgage Type
FHA
Purchase Details
Closed on
Oct 30, 1997
Sold by
Ramsey Kathryn V and Ramsey Mcclurg Kathryn V
Bought by
Gonzalez Daniel
Home Financials for this Owner
Home Financials are based on the most recent Mortgage that was taken out on this home.
Original Mortgage
$104,192
Interest Rate
7.46%
Mortgage Type
FHA
Create a Home Valuation Report for This Property
The Home Valuation Report is an in-depth analysis detailing your home's value as well as a comparison with similar homes in the area
Home Values in the Area
Average Home Value in this Area
Purchase History
| Date | Buyer | Sale Price | Title Company |
|---|---|---|---|
| Just Keith | -- | None Listed On Document | |
| Just Keith | -- | None Available | |
| Just Keith E | $133,000 | Pntn | |
| Gonzalez Daniel | $105,000 | -- |
Source: Public Records
Mortgage History
| Date | Status | Borrower | Loan Amount |
|---|---|---|---|
| Previous Owner | Just Keith E | $130,945 | |
| Previous Owner | Gonzalez Daniel | $104,192 |
Source: Public Records
Tax History Compared to Growth
Tax History
| Year | Tax Paid | Tax Assessment Tax Assessment Total Assessment is a certain percentage of the fair market value that is determined by local assessors to be the total taxable value of land and additions on the property. | Land | Improvement |
|---|---|---|---|---|
| 2024 | $3,880 | $58,480 | $12,389 | $46,091 |
| 2023 | $3,649 | $52,303 | $11,080 | $41,223 |
| 2022 | $3,254 | $44,612 | $8,517 | $36,095 |
| 2021 | $3,100 | $41,562 | $7,935 | $33,627 |
| 2020 | $3,010 | $40,091 | $7,654 | $32,437 |
| 2019 | $2,911 | $38,372 | $7,326 | $31,046 |
| 2018 | $2,716 | $35,126 | $6,768 | $28,358 |
| 2017 | $2,615 | $33,091 | $6,376 | $26,715 |
| 2016 | $2,550 | $31,036 | $5,980 | $25,056 |
| 2013 | -- | $39,232 | $5,578 | $33,654 |
Source: Public Records
Map
Nearby Homes
- 2150 E Algonquin Rd
- 1670 Yosemite Pkwy
- 1943 Ozark Pkwy
- 2 Cumberland Pkwy
- 1782 Cumberland Pkwy
- 2003 Magenta Ln
- 460 Mahogany Dr
- 451 Mahogany Dr
- 2260 Indigo Dr
- 1770 E Algonquin Rd
- Lot 4 b Ryan Pkwy
- 1561 Cumberland Pkwy
- 2008 Clematis Dr
- 1659 E Algonquin Rd
- 400 Diamond Back Way
- 9999 Sandbloom Rd
- 1551 Glacier Trail Unit 644
- 605 Claymont Ct
- 601 Lake Cornish Way
- 2245 Flagstone Ln Unit 155
- 2126 Teton Pkwy
- 2122 Teton Pkwy
- 2128 Teton Pkwy Unit 1
- 2120 Teton Pkwy
- 2130 Teton Pkwy
- 2161 Cumberland Pkwy
- 2112 Teton Pkwy Unit 1
- 2171 Cumberland Pkwy
- 2151 Cumberland Pkwy
- 2202 Teton Pkwy
- 2110 Teton Pkwy
- 2123 Teton Pkwy Unit 1
- 2121 Teton Pkwy
- 2111 Teton Pkwy
- 2127 Teton Pkwy
- 2204 Teton Pkwy
- 2181 Cumberland Pkwy
- 2108 Teton Pkwy
- 2129 Teton Pkwy
- 2141 Cumberland Pkwy