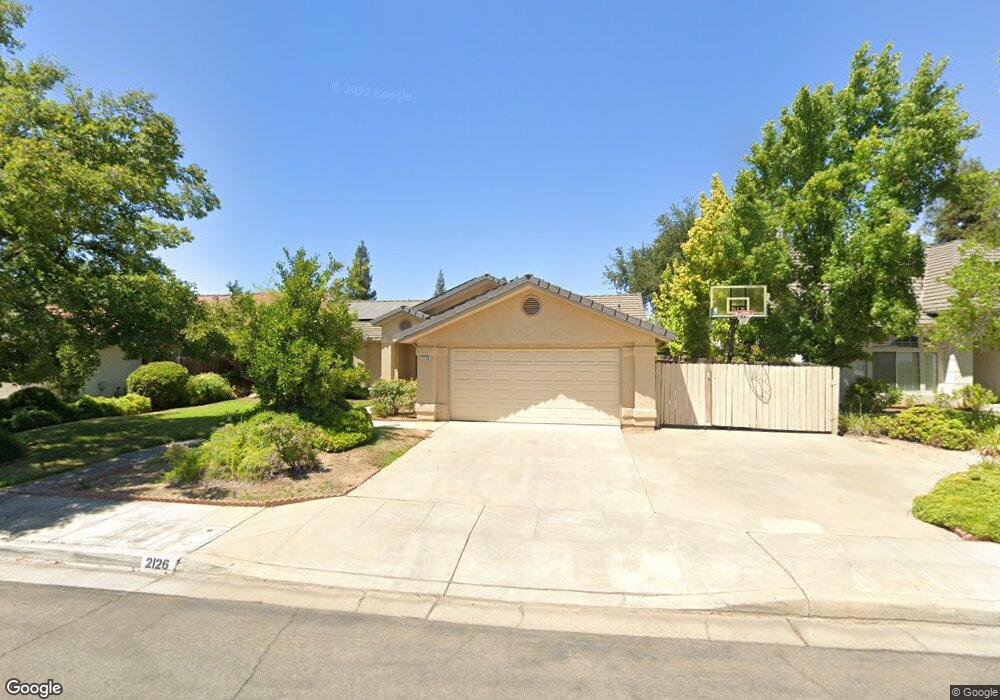
2126 E Pryor Dr Fresno, CA 93720
Woodward Park NeighborhoodEstimated Value: $452,968 - $481,000
3
Beds
3
Baths
1,596
Sq Ft
$292/Sq Ft
Est. Value
About This Home
This home is located at 2126 E Pryor Dr, Fresno, CA 93720 and is currently estimated at $465,989, approximately $291 per square foot. 2126 E Pryor Dr is a home located in Fresno County with nearby schools including Liberty Elementary School, Kastner Intermediate School, and Clovis West High School.
Ownership History
Date
Name
Owned For
Owner Type
Purchase Details
Closed on
May 27, 2018
Sold by
Vantrinh Ca Van
Bought by
Trinh Chi Lan and Trinh Joshkher
Current Estimated Value
Purchase Details
Closed on
Oct 9, 2007
Sold by
Vantrinh Ca
Bought by
Chi Vantrinh Ca and Chi Lan Trinh
Purchase Details
Closed on
Dec 13, 2004
Sold by
Trinh Anh L
Bought by
Trinh Ca V
Purchase Details
Closed on
Nov 16, 2001
Sold by
Gallegos David and Prince Patricia
Bought by
Trinh Anh L and Trinh Ca V
Home Financials for this Owner
Home Financials are based on the most recent Mortgage that was taken out on this home.
Original Mortgage
$99,977
Interest Rate
6.51%
Mortgage Type
FHA
Purchase Details
Closed on
Mar 29, 1995
Sold by
Poule Darren M and Canterbury Masami K
Bought by
Gallegos David and Prince Patricia
Home Financials for this Owner
Home Financials are based on the most recent Mortgage that was taken out on this home.
Original Mortgage
$110,225
Interest Rate
8.44%
Mortgage Type
FHA
Create a Home Valuation Report for This Property
The Home Valuation Report is an in-depth analysis detailing your home's value as well as a comparison with similar homes in the area
Home Values in the Area
Average Home Value in this Area
Purchase History
| Date | Buyer | Sale Price | Title Company |
|---|---|---|---|
| Trinh Chi Lan | -- | None Available | |
| Chi Vantrinh Ca | -- | None Available | |
| Trinh Ca V | -- | -- | |
| Trinh Anh L | $149,500 | First American Title Co | |
| Gallegos David | $111,000 | Chicago Title |
Source: Public Records
Mortgage History
| Date | Status | Borrower | Loan Amount |
|---|---|---|---|
| Previous Owner | Trinh Anh L | $99,977 | |
| Previous Owner | Gallegos David | $110,225 |
Source: Public Records
Tax History
| Year | Tax Paid | Tax Assessment Tax Assessment Total Assessment is a certain percentage of the fair market value that is determined by local assessors to be the total taxable value of land and additions on the property. | Land | Improvement |
|---|---|---|---|---|
| 2025 | $3,533 | $295,783 | $90,727 | $205,056 |
| 2023 | $3,464 | $284,300 | $87,205 | $197,095 |
| 2022 | $3,350 | $278,727 | $85,496 | $193,231 |
| 2021 | $3,256 | $273,263 | $83,820 | $189,443 |
| 2020 | $3,242 | $270,462 | $82,961 | $187,501 |
| 2019 | $3,178 | $265,160 | $81,335 | $183,825 |
| 2018 | $2,889 | $234,857 | $72,082 | $162,775 |
| 2017 | $2,840 | $230,253 | $70,669 | $159,584 |
| 2016 | $2,745 | $225,739 | $69,284 | $156,455 |
| 2015 | $2,704 | $222,349 | $68,244 | $154,105 |
| 2014 | $2,652 | $217,800 | $66,500 | $151,300 |
Source: Public Records
Map
Nearby Homes
- 2102 E Shea Dr
- 2233 E Christopher Dr
- 2230 E Ryan Ave
- 2293 E Ryan Ave
- 9322 N Jackson Ave
- 2169 E Hillview Ave
- 2404 E Pryor Dr
- 2439 E Okeefe Dr
- 2471 E Okeefe Dr
- 2447 E Okeefe Dr
- 1771 E Pryor Dr
- 9356 N Jade Ave
- 1732 E Morningstar Ln
- 9564 N Larkspur Ave
- 9544 N Larkspur Ave
- 8847 N Woodrow Ave
- 2602 E Deyoung Dr
- 2235 E Lester Ave
- 1786 E Everglade Ave
- 1824 E Lester Ave
- 2114 E Pryor Dr
- 2138 E Pryor Dr
- 2125 E Shea Dr
- 2113 E Shea Dr
- 2102 E Pryor Dr
- 2135 E Shea Dr
- 2148 E Pryor Dr
- 2127 E Pryor Dr
- 2115 E Pryor Dr
- 2137 E Pryor Dr
- 2101 E Shea Dr
- 2147 E Shea Dr
- 2103 E Pryor Dr
- 2090 E Pryor Dr
- 2147 E Pryor Dr
- 2160 E Pryor Dr
- 2089 E Shea Dr
- 2091 E Pryor Dr
- 2159 E Shea Dr
- 2159 E Pryor Dr
Your Personal Tour Guide
Ask me questions while you tour the home.