Estimated Value: $227,000 - $281,000
3
Beds
1
Bath
1,045
Sq Ft
$242/Sq Ft
Est. Value
About This Home
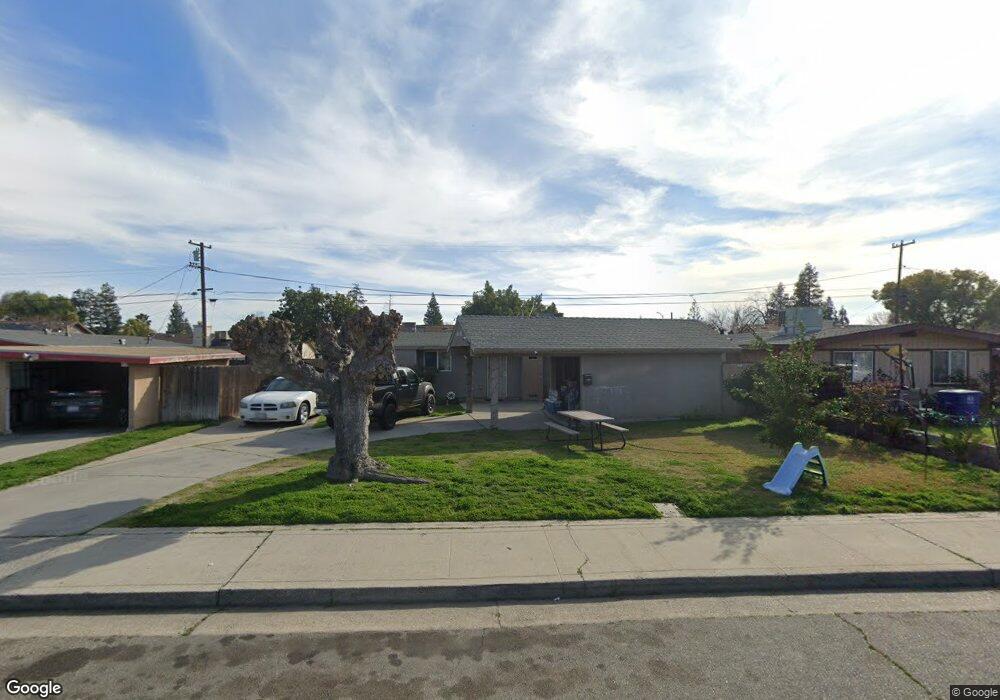
This home is located at 2129 Aspen St, Selma, CA 93662 and is currently estimated at $253,285, approximately $242 per square foot. 2129 Aspen St is a home located in Fresno County with nearby schools including Theodore Roosevelt Elementary School, Abraham Lincoln Middle School, and Selma High School.
Ownership History
Date
Name
Owned For
Owner Type
Purchase Details
Closed on
Jul 20, 2010
Sold by
Sjvr Rental Properties
Bought by
Cervantes Jose Luis and Cervantes Jose Martin
Current Estimated Value
Purchase Details
Closed on
Mar 1, 2010
Sold by
Hovannisian Ralph and Hovannisian Janet
Bought by
Sjvr Rental Properties Llc
Purchase Details
Closed on
Oct 25, 1999
Sold by
Avco Financial Services Of Southern and California Inc
Bought by
Hovannisian Ralph and Hovannisian Janet
Purchase Details
Closed on
Nov 20, 1998
Sold by
Dale Cypert Warren
Bought by
Avco Financial Services Of Southern Cali
Create a Home Valuation Report for This Property
The Home Valuation Report is an in-depth analysis detailing your home's value as well as a comparison with similar homes in the area
Home Values in the Area
Average Home Value in this Area
Purchase History
| Date | Buyer | Sale Price | Title Company |
|---|---|---|---|
| Cervantes Jose Luis | $65,500 | North American Title Co Inc | |
| Sjvr Rental Properties Llc | -- | None Available | |
| Hovannisian Ralph | $32,500 | First American Title Co | |
| Avco Financial Services Of Southern Cali | $52,360 | Fidelity National Title Ins |
Source: Public Records
Tax History Compared to Growth
Tax History
| Year | Tax Paid | Tax Assessment Tax Assessment Total Assessment is a certain percentage of the fair market value that is determined by local assessors to be the total taxable value of land and additions on the property. | Land | Improvement |
|---|---|---|---|---|
| 2025 | $1,835 | $81,982 | $44,833 | $37,149 |
| 2023 | $2,392 | $78,800 | $43,093 | $35,707 |
| 2022 | $1,753 | $77,256 | $42,249 | $35,007 |
| 2021 | $1,704 | $75,742 | $41,421 | $34,321 |
| 2020 | $1,675 | $74,967 | $40,997 | $33,970 |
| 2019 | $1,619 | $73,498 | $40,194 | $33,304 |
| 2018 | $1,576 | $72,057 | $39,406 | $32,651 |
| 2017 | $1,501 | $70,645 | $38,634 | $32,011 |
| 2016 | $1,366 | $69,261 | $37,877 | $31,384 |
| 2015 | $1,378 | $68,222 | $37,309 | $30,913 |
| 2014 | $1,329 | $66,887 | $36,579 | $30,308 |
Source: Public Records
Map
Nearby Homes