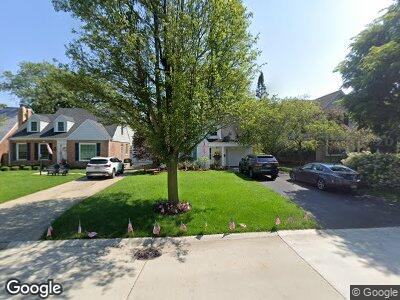
2129 Fir St Glenview, IL 60025
Estimated Value: $901,199 - $1,018,000
4
Beds
2
Baths
2,268
Sq Ft
$418/Sq Ft
Est. Value
About This Home
This home is located at 2129 Fir St, Glenview, IL 60025 and is currently estimated at $948,300, approximately $418 per square foot. 2129 Fir St is a home located in Cook County with nearby schools including Lyon Elementary School, Pleasant Ridge Elementary School, and Springman Middle School.
Ownership History
Date
Name
Owned For
Owner Type
Purchase Details
Closed on
Jul 21, 2004
Sold by
Mahon Robert C and Mahon Eileen M
Bought by
Branstrom Jay E and Branstrom Kirsten M
Current Estimated Value
Home Financials for this Owner
Home Financials are based on the most recent Mortgage that was taken out on this home.
Original Mortgage
$532,000
Interest Rate
6.42%
Mortgage Type
New Conventional
Purchase Details
Closed on
Jan 12, 1998
Sold by
Jennings James R and Jennings Elizabeth H
Bought by
Mahon Robert C and Mahon Eileen M
Home Financials for this Owner
Home Financials are based on the most recent Mortgage that was taken out on this home.
Original Mortgage
$372,000
Interest Rate
7.12%
Create a Home Valuation Report for This Property
The Home Valuation Report is an in-depth analysis detailing your home's value as well as a comparison with similar homes in the area
Home Values in the Area
Average Home Value in this Area
Purchase History
| Date | Buyer | Sale Price | Title Company |
|---|---|---|---|
| Branstrom Jay E | $665,000 | Git | |
| Mahon Robert C | $465,000 | -- |
Source: Public Records
Mortgage History
| Date | Status | Borrower | Loan Amount |
|---|---|---|---|
| Open | Branstrom Jay E | $555,500 | |
| Closed | Branstrom Jay E | $510,000 | |
| Closed | Branstrom Jay E | $507,000 | |
| Closed | Branstrom Jay E | $424,100 | |
| Closed | Branstrom Jay E | $100,000 | |
| Closed | Branstrom Jay E | $92,500 | |
| Closed | Branstrom Jay E | $532,000 | |
| Closed | Branstrom Jay E | $114,300 | |
| Closed | Branstrom Jay E | $530,000 | |
| Closed | Branstrom Jay E | $528,000 | |
| Closed | Branstrom Jay E | $532,000 | |
| Previous Owner | Mahon Robert C | $407,000 | |
| Previous Owner | Mahon Robert C | $404,000 | |
| Previous Owner | Mahon Robert C | $416,000 | |
| Previous Owner | Mahon Robert C | $372,000 | |
| Closed | Branstrom Jay E | $66,500 |
Source: Public Records
Tax History Compared to Growth
Tax History
| Year | Tax Paid | Tax Assessment Tax Assessment Total Assessment is a certain percentage of the fair market value that is determined by local assessors to be the total taxable value of land and additions on the property. | Land | Improvement |
|---|---|---|---|---|
| 2024 | $15,181 | $69,201 | $10,800 | $58,401 |
| 2023 | $15,181 | $69,201 | $10,800 | $58,401 |
| 2022 | $15,181 | $74,000 | $10,800 | $63,200 |
| 2021 | $9,602 | $41,908 | $8,775 | $33,133 |
| 2020 | $9,544 | $41,908 | $8,775 | $33,133 |
| 2019 | $8,891 | $46,053 | $8,775 | $37,278 |
| 2018 | $10,692 | $49,923 | $7,593 | $42,330 |
| 2017 | $10,420 | $49,923 | $7,593 | $42,330 |
| 2016 | $10,032 | $49,923 | $7,593 | $42,330 |
| 2015 | $10,011 | $44,663 | $6,075 | $38,588 |
| 2014 | $9,841 | $44,663 | $6,075 | $38,588 |
| 2013 | $9,527 | $44,663 | $6,075 | $38,588 |
Source: Public Records
Map
Nearby Homes
- 2114 Prairie St
- 2300 Swainwood Dr
- 1220 Depot St Unit 112
- 1220 Depot St Unit 211
- 2135 Henley St
- 1251 Pine St
- 2362 Dewes St
- 960 Shermer Rd Unit 2
- 921 Harlem Ave Unit 1
- 956 Shermer Rd Unit 14
- 1820 Henley St
- 1305 Sleepy Hollow Rd
- 1752 Maclean Ct
- 1736 Maclean Ct
- 1699 Bluestem Ln Unit 1
- 1724 Bluestem Ln Unit 2
- 2232 Central Rd
- 1929 Robincrest Ln
- 1619 Patriot Blvd
- 1958 Central Rd