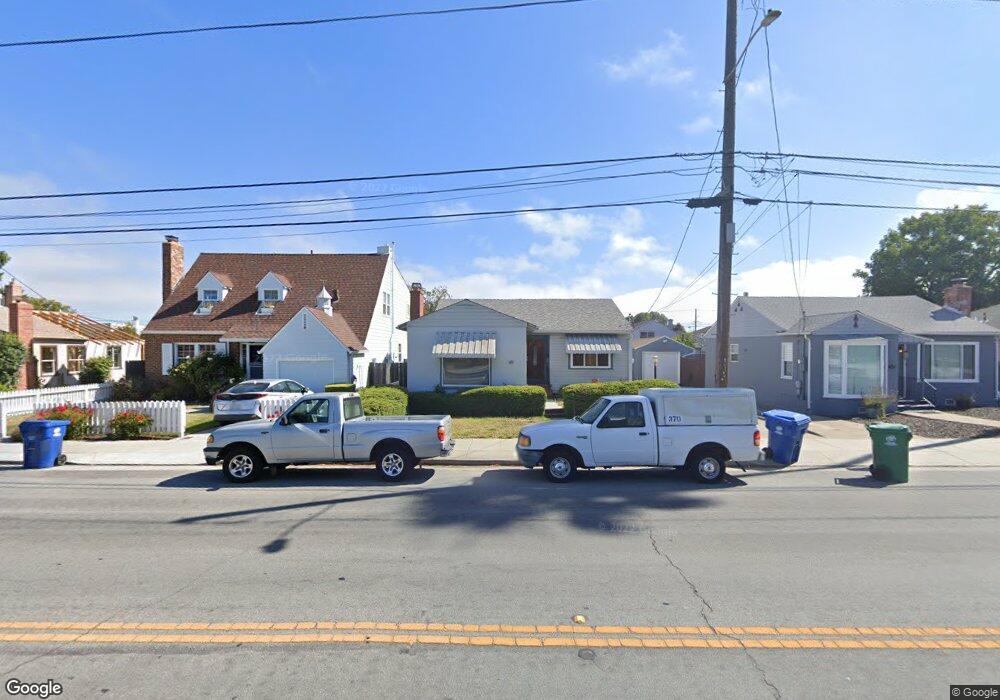
213 Central Ave Alameda, CA 94501
West Alameda NeighborhoodEstimated Value: $1,101,797 - $1,251,000
2
Beds
2
Baths
1,320
Sq Ft
$894/Sq Ft
Est. Value
About This Home
This home is located at 213 Central Ave, Alameda, CA 94501 and is currently estimated at $1,179,449, approximately $893 per square foot. 213 Central Ave is a home located in Alameda County with nearby schools including William G. Paden Elementary School, Encinal Junior/Senior High, and The Academy of Alameda TK-8 School.
Ownership History
Date
Name
Owned For
Owner Type
Purchase Details
Closed on
May 27, 2005
Sold by
Mauldin Shawn and Mauldin Tonya D
Bought by
Morrison Patrick and Willis Kittina
Current Estimated Value
Home Financials for this Owner
Home Financials are based on the most recent Mortgage that was taken out on this home.
Original Mortgage
$540,000
Outstanding Balance
$281,549
Interest Rate
5.74%
Mortgage Type
Fannie Mae Freddie Mac
Estimated Equity
$897,900
Purchase Details
Closed on
Nov 4, 2004
Sold by
Citerley Richard L and Laura S Citerley Family Living
Bought by
Mauldin Shawn and Mauldin Tonya D
Home Financials for this Owner
Home Financials are based on the most recent Mortgage that was taken out on this home.
Original Mortgage
$384,000
Interest Rate
1.75%
Mortgage Type
New Conventional
Purchase Details
Closed on
May 4, 2004
Sold by
Citerley Laura S and Laura S Citerley Family Living
Bought by
Citerley Richard L and Laura S Citerley Family Living
Create a Home Valuation Report for This Property
The Home Valuation Report is an in-depth analysis detailing your home's value as well as a comparison with similar homes in the area
Home Values in the Area
Average Home Value in this Area
Purchase History
| Date | Buyer | Sale Price | Title Company |
|---|---|---|---|
| Morrison Patrick | $675,000 | North American Title Co | |
| Mauldin Shawn | $480,000 | North American Title Co | |
| Citerley Richard L | -- | -- |
Source: Public Records
Mortgage History
| Date | Status | Borrower | Loan Amount |
|---|---|---|---|
| Open | Morrison Patrick | $540,000 | |
| Previous Owner | Mauldin Shawn | $384,000 | |
| Closed | Mauldin Shawn | $48,000 | |
| Closed | Morrison Patrick | $135,000 |
Source: Public Records
Tax History Compared to Growth
Tax History
| Year | Tax Paid | Tax Assessment Tax Assessment Total Assessment is a certain percentage of the fair market value that is determined by local assessors to be the total taxable value of land and additions on the property. | Land | Improvement |
|---|---|---|---|---|
| 2025 | $13,128 | $933,801 | $282,240 | $658,561 |
| 2024 | $13,128 | $915,360 | $276,708 | $645,652 |
| 2023 | $12,608 | $904,277 | $271,283 | $632,994 |
| 2022 | $12,314 | $879,551 | $265,965 | $620,586 |
| 2021 | $12,001 | $862,170 | $260,751 | $608,419 |
| 2020 | $11,850 | $860,260 | $258,078 | $602,182 |
| 2019 | $11,379 | $843,398 | $253,019 | $590,379 |
| 2018 | $11,084 | $826,867 | $248,060 | $578,807 |
| 2017 | $10,558 | $810,661 | $243,198 | $567,463 |
| 2016 | $9,768 | $725,000 | $217,500 | $507,500 |
| 2015 | $9,041 | $655,000 | $196,500 | $458,500 |
| 2014 | $8,242 | $613,000 | $183,900 | $429,100 |
Source: Public Records
Map
Nearby Homes
- 333 Central Ave
- 221 Pacific Ave
- 310 Spruce St
- 109 Cypress St Unit C
- 108 Cypress St Unit D
- 219 Cypress St Unit K
- 1820 3rd St
- 1808 Main St
- 2180 Barnes Wharf Ln
- 2058 Barnes Wharf Ln
- 629 Santa Clara Ave
- 1327 Webster St Unit B210
- 1327 Webster St Unit B101
- 1321 Webster St Unit D119
- 1321 Webster St Unit D212
- 1321 Webster St Unit D116
- 1333 Webster St Unit A107
- 1305 Webster St Unit C309
- 1311 Webster St Unit E316
- 2428 Teal Ln
- 211 Central Ave
- 217 Central Ave
- 209 Central Ave
- 214 Santa Clara Ave
- 216 Santa Clara Ave
- 219 Central Ave
- 212 Santa Clara Ave
- 207 Central Ave
- 218 Santa Clara Ave
- 210 Santa Clara Ave
- 220 Santa Clara Ave
- 221 Central Ave
- 203 Central Ave
- 208 Santa Clara Ave
- 222 Santa Clara Ave
- 223 Central Ave
- 226 Santa Clara Ave
- 204 Santa Clara Ave
- 201 Central Ave
- 228 Santa Clara Ave