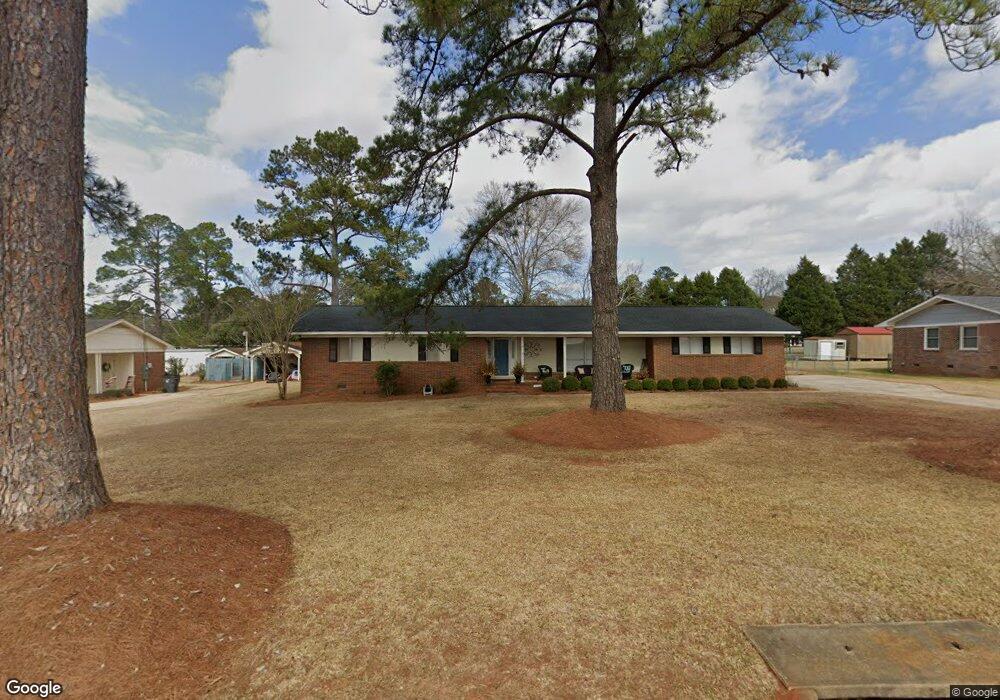
213 Glenwood Rd Americus, GA 31709
Estimated Value: $169,494 - $184,000
3
Beds
2
Baths
1,544
Sq Ft
$115/Sq Ft
Est. Value
About This Home
This home is located at 213 Glenwood Rd, Americus, GA 31709 and is currently estimated at $177,624, approximately $115 per square foot. 213 Glenwood Rd is a home located in Sumter County with nearby schools including Sumter County Primary School, Sumter County Elementary School, and Sumter County Middle School.
Ownership History
Date
Name
Owned For
Owner Type
Purchase Details
Closed on
Feb 16, 2017
Sold by
Edgy Hollie Harrell
Bought by
Jenkins David C
Current Estimated Value
Home Financials for this Owner
Home Financials are based on the most recent Mortgage that was taken out on this home.
Original Mortgage
$86,602
Outstanding Balance
$72,101
Interest Rate
4.4%
Mortgage Type
FHA
Estimated Equity
$105,523
Purchase Details
Closed on
Dec 15, 2009
Sold by
Davis Brian D
Bought by
Harrell Hollie J
Home Financials for this Owner
Home Financials are based on the most recent Mortgage that was taken out on this home.
Original Mortgage
$79,950
Interest Rate
4.82%
Mortgage Type
New Conventional
Purchase Details
Closed on
Aug 27, 2004
Sold by
Mcaneny Samuel
Bought by
Davis Brian D
Purchase Details
Closed on
Sep 29, 1989
Bought by
Mcaneny Samuel
Create a Home Valuation Report for This Property
The Home Valuation Report is an in-depth analysis detailing your home's value as well as a comparison with similar homes in the area
Home Values in the Area
Average Home Value in this Area
Purchase History
| Date | Buyer | Sale Price | Title Company |
|---|---|---|---|
| Jenkins David C | $88,200 | -- | |
| Harrell Hollie J | $123,000 | -- | |
| Davis Brian D | $100,000 | -- | |
| Mcaneny Samuel | $66,900 | -- |
Source: Public Records
Mortgage History
| Date | Status | Borrower | Loan Amount |
|---|---|---|---|
| Open | Jenkins David C | $86,602 | |
| Previous Owner | Harrell Hollie J | $79,950 |
Source: Public Records
Tax History Compared to Growth
Tax History
| Year | Tax Paid | Tax Assessment Tax Assessment Total Assessment is a certain percentage of the fair market value that is determined by local assessors to be the total taxable value of land and additions on the property. | Land | Improvement |
|---|---|---|---|---|
| 2024 | $1,642 | $36,400 | $4,880 | $31,520 |
| 2023 | $1,606 | $36,400 | $4,880 | $31,520 |
| 2022 | $1,100 | $36,400 | $4,880 | $31,520 |
| 2021 | $1,608 | $36,400 | $4,880 | $31,520 |
| 2020 | $1,647 | $36,400 | $4,880 | $31,520 |
| 2019 | $1,742 | $36,400 | $4,880 | $31,520 |
| 2018 | $1,110 | $36,400 | $4,880 | $31,520 |
| 2017 | $1,145 | $36,400 | $4,880 | $31,520 |
| 2016 | $1,608 | $36,400 | $4,880 | $31,520 |
| 2015 | $1,123 | $36,680 | $4,880 | $31,800 |
| 2014 | $1,125 | $36,680 | $4,880 | $31,800 |
| 2013 | -- | $36,680 | $4,880 | $31,800 |
Source: Public Records
Map
Nearby Homes
- TBD Valley Dr
- 205 Valley Dr
- 104 Westlake Cir
- TBD Grande Ave
- 1202 S Lee St
- 1105 Elm Ave
- 130 W Dodson St
- 126 Bell St
- Lot 5 Lake Jennifer Dr
- 115 Lake Jennifer Dr
- 229 Bell St
- 704 Harrold Ave
- 624 Harrold Ave
- 302 W College St
- 501 S Lee St
- 0 Beale St
- 518 E Furlow St
- 406 S Hampton St
- 105 Springfield Ave
- 316 Taylor St
- 211 Glenwood Rd
- 208 Shirley Rd
- 214 Shirley Rd
- 210 Shirley Rd
- 212 Glenwood Rd
- 214 Glenwood Rd
- 217 Glenwood Rd
- 209 Glenwood Rd
- 216 Glenwood Rd
- 210 Glenwood Rd
- 204 Shirley Rd
- 218 Shirley Rd
- 218 Glenwood Rd
- 208 Glenwood Rd
- 219 Glenwood Rd
- 209 Shirley Rd
- 207 Glenwood Rd
- 1914 Rose Ave
- 213 Shirley Rd
- 1912 Rose Ave