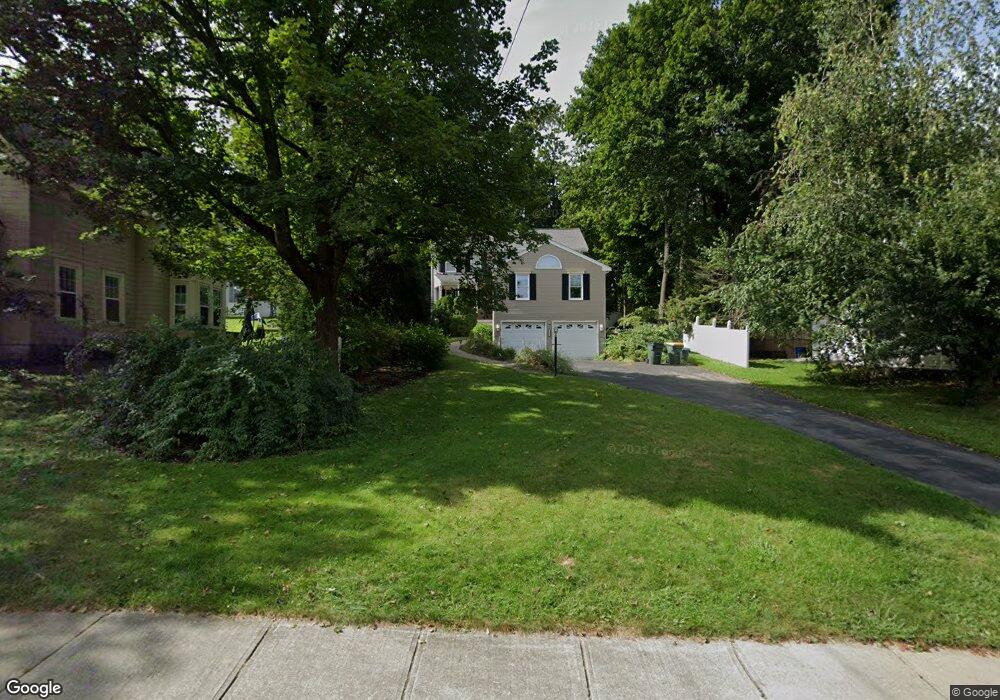
213 Peck St Franklin, MA 02038
Downtown Franklin NeighborhoodEstimated Value: $694,086 - $762,000
3
Beds
4
Baths
2,112
Sq Ft
$346/Sq Ft
Est. Value
About This Home
This home is located at 213 Peck St, Franklin, MA 02038 and is currently estimated at $730,272, approximately $345 per square foot. 213 Peck St is a home located in Norfolk County with nearby schools including Gerald M. Parmenter Elementary School, Remington Middle School, and Franklin High School.
Ownership History
Date
Name
Owned For
Owner Type
Purchase Details
Closed on
Oct 2, 2006
Sold by
Obrien Brian M and Obrien Christine N
Bought by
Courtright Celia M and Lim Christian M
Current Estimated Value
Home Financials for this Owner
Home Financials are based on the most recent Mortgage that was taken out on this home.
Original Mortgage
$348,750
Outstanding Balance
$208,795
Interest Rate
6.52%
Mortgage Type
Purchase Money Mortgage
Estimated Equity
$521,477
Create a Home Valuation Report for This Property
The Home Valuation Report is an in-depth analysis detailing your home's value as well as a comparison with similar homes in the area
Home Values in the Area
Average Home Value in this Area
Purchase History
| Date | Buyer | Sale Price | Title Company |
|---|---|---|---|
| Courtright Celia M | $465,000 | -- |
Source: Public Records
Mortgage History
| Date | Status | Borrower | Loan Amount |
|---|---|---|---|
| Open | Courtright Celia M | $348,750 | |
| Closed | Courtright Celia M | $93,000 |
Source: Public Records
Tax History
| Year | Tax Paid | Tax Assessment Tax Assessment Total Assessment is a certain percentage of the fair market value that is determined by local assessors to be the total taxable value of land and additions on the property. | Land | Improvement |
|---|---|---|---|---|
| 2025 | $7,310 | $629,100 | $221,000 | $408,100 |
| 2024 | $6,608 | $560,500 | $221,000 | $339,500 |
| 2023 | $6,286 | $499,700 | $204,400 | $295,300 |
| 2022 | $6,254 | $445,100 | $184,200 | $260,900 |
| 2021 | $5,797 | $395,700 | $172,900 | $222,800 |
| 2020 | $5,971 | $411,500 | $199,500 | $212,000 |
| 2019 | $5,593 | $381,500 | $169,500 | $212,000 |
| 2018 | $5,374 | $366,800 | $176,200 | $190,600 |
| 2017 | $5,202 | $356,800 | $166,200 | $190,600 |
| 2016 | $5,378 | $370,900 | $179,500 | $191,400 |
| 2015 | $5,138 | $346,200 | $154,800 | $191,400 |
| 2014 | $4,646 | $321,500 | $130,100 | $191,400 |
Source: Public Records
Map
Nearby Homes
- 82 Uncas Ave Unit 1
- 99 Summer St
- 64 Uncas Ave
- 62 Uncas Ave
- 90 E Central St Unit 103
- 90 E Central St Unit 106
- 90 E Central St Unit 304
- 90 E Central St Unit 202
- 90 E Central St Unit 105
- 90 E Central St Unit 301
- 374-378 Union St
- 1 Washington St
- 3 Washington St
- 0 Fall Ln
- 30 Longobardi Dr Unit 30
- 120 Union St Unit 1
- 14 Pleasant St Unit B
- 12 Garden St
- 732 King St
- 70 Oak St
Your Personal Tour Guide
Ask me questions while you tour the home.