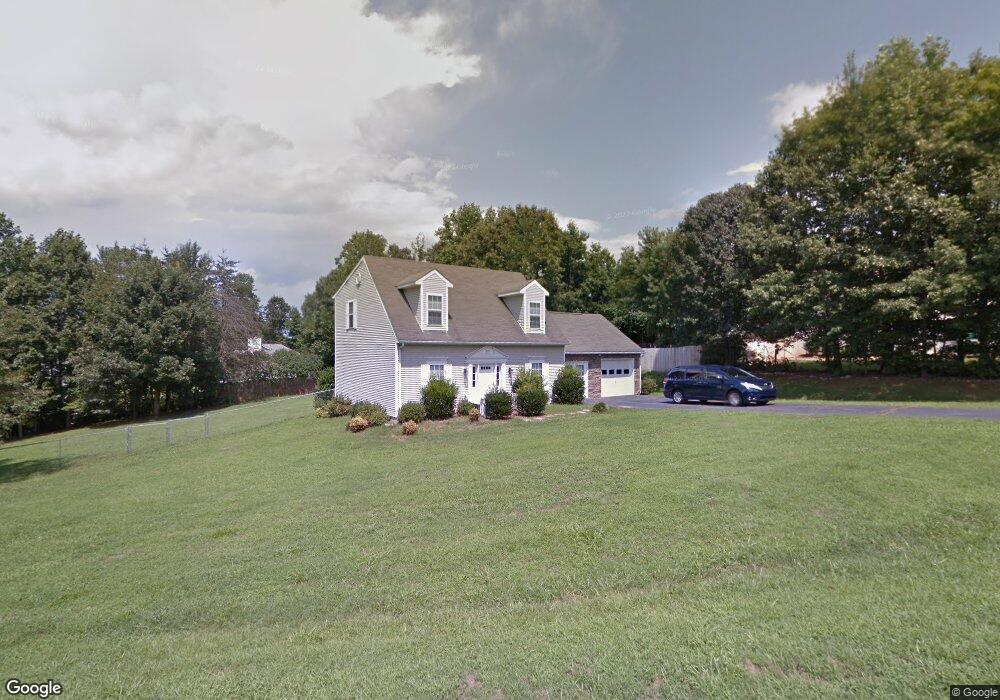
213 Sequoyah Cir Morganton, NC 28655
Estimated Value: $278,000 - $326,000
3
Beds
2
Baths
1,209
Sq Ft
$246/Sq Ft
Est. Value
About This Home
This home is located at 213 Sequoyah Cir, Morganton, NC 28655 and is currently estimated at $296,843, approximately $245 per square foot. 213 Sequoyah Cir is a home located in Burke County with nearby schools including Drexel Elementary School, Heritage Middle School, and Jimmy C. Draughn High School.
Ownership History
Date
Name
Owned For
Owner Type
Purchase Details
Closed on
Nov 11, 2019
Sold by
Patel Gautambhai Bhikhabhai and Patel Vaishalien G
Bought by
Patel Niles Ravjikumar
Current Estimated Value
Purchase Details
Closed on
Aug 2, 2012
Sold by
Lockee Coyte and Lockee Regina I
Bought by
Patel Gautambhai Bhikhabhai and Patel Vaishaliben G
Home Financials for this Owner
Home Financials are based on the most recent Mortgage that was taken out on this home.
Original Mortgage
$114,285
Interest Rate
3.68%
Mortgage Type
New Conventional
Purchase Details
Closed on
Oct 3, 2011
Sold by
Secretary Of Housing & Urban Development
Bought by
Lockee Coyte
Purchase Details
Closed on
Jul 30, 2010
Sold by
Johnson Herman and Oates Regina
Bought by
The Secretary Of Housing & Urban Develop
Purchase Details
Closed on
Apr 11, 2006
Sold by
Smith Wesley S and Smith Jennifer R
Bought by
Johnson Herman and Oates Regina
Home Financials for this Owner
Home Financials are based on the most recent Mortgage that was taken out on this home.
Original Mortgage
$145,289
Interest Rate
6.23%
Mortgage Type
FHA
Create a Home Valuation Report for This Property
The Home Valuation Report is an in-depth analysis detailing your home's value as well as a comparison with similar homes in the area
Home Values in the Area
Average Home Value in this Area
Purchase History
| Date | Buyer | Sale Price | Title Company |
|---|---|---|---|
| Patel Niles Ravjikumar | $155,000 | None Available | |
| Patel Gautambhai Bhikhabhai | $123,000 | None Available | |
| Lockee Coyte | -- | None Available | |
| The Secretary Of Housing & Urban Develop | $156,782 | None Available | |
| Johnson Herman | $148,000 | None Available |
Source: Public Records
Mortgage History
| Date | Status | Borrower | Loan Amount |
|---|---|---|---|
| Previous Owner | Patel Gautambhai Bhikhabhai | $114,285 | |
| Previous Owner | Johnson Herman | $145,289 |
Source: Public Records
Tax History
| Year | Tax Paid | Tax Assessment Tax Assessment Total Assessment is a certain percentage of the fair market value that is determined by local assessors to be the total taxable value of land and additions on the property. | Land | Improvement |
|---|---|---|---|---|
| 2025 | $1,384 | $231,938 | $20,500 | $211,438 |
| 2024 | $1,392 | $231,938 | $20,500 | $211,438 |
| 2023 | $1,387 | $231,938 | $20,500 | $211,438 |
| 2022 | $1,321 | $178,242 | $20,500 | $157,742 |
| 2021 | $1,315 | $178,242 | $20,500 | $157,742 |
| 2020 | $1,311 | $178,242 | $20,500 | $157,742 |
| 2019 | $1,155 | $155,865 | $20,500 | $135,365 |
| 2018 | $1,020 | $136,441 | $20,500 | $115,941 |
| 2017 | $1,018 | $136,441 | $20,500 | $115,941 |
| 2016 | $993 | $136,441 | $20,500 | $115,941 |
| 2015 | $990 | $136,441 | $20,500 | $115,941 |
| 2014 | $988 | $136,441 | $20,500 | $115,941 |
| 2013 | $988 | $136,441 | $20,500 | $115,941 |
Source: Public Records
Map
Nearby Homes
- 1919 Highway 70 E
- 1855 Eastbrook Cir
- 0 Amherst Rd
- 1401 E Union St
- 2088 E Winds Ave
- 2169 E Winds Ave
- 1307 E Union St
- 104 Ivy Ct
- 102 Ivy Ct
- 108 Ones Branch Ct
- 102 Bayern Crest Unit 6
- 761 Amherst Rd
- 225 Henrys Glen Dr
- 225 Henry's Glen Dr
- 350 Summers Rd
- 2290 U S 70
- 102 Castlegate Dr
- 2986 Green Pasture Ln
- 203 Heritage Ln
- 135 Hilltop St
- 215 Sequoyah Cir
- 211 Sequoyah Cir Unit 30
- 228 Sequoyah Cir
- 209 Sequoyah Cir
- 232 Sequoyah Cir
- 217 Sequoyah Cir
- 109 Linwood Dr Unit 42-70-3-37
- 230 Sequoyah Cir
- 226 Sequoyah Cir
- 234 Sequoyah Cir
- 207 Sequoyah Cir
- 236 Sequoyah Cir
- 219 Sequoyah Cir
- 220 Sequoyah Cir
- 222 Sequoyah Cir
- 205 Sequoyah Cir
- 1807 Us Hwy 70e
- 216 Sequoyah Cir Unit L13
- 1807 Us 70 E
- 238 Sequoyah Cir
Your Personal Tour Guide
Ask me questions while you tour the home.