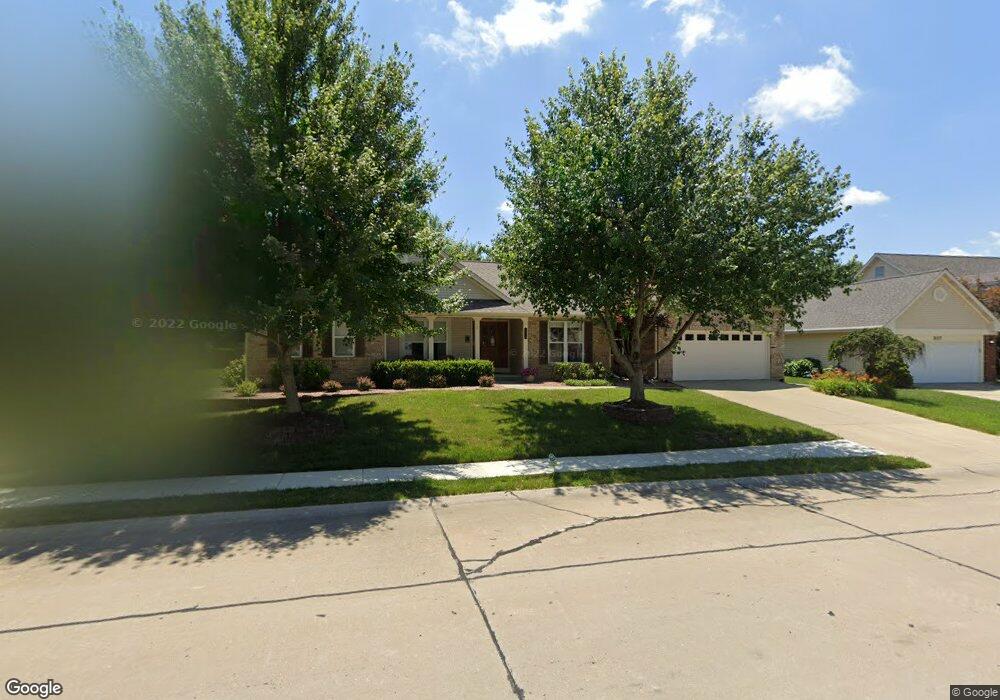
213 W Deer Creek Rd O Fallon, IL 62269
Estimated Value: $401,361 - $454,000
4
Beds
2
Baths
2,765
Sq Ft
$157/Sq Ft
Est. Value
About This Home
This home is located at 213 W Deer Creek Rd, O Fallon, IL 62269 and is currently estimated at $435,340, approximately $157 per square foot. 213 W Deer Creek Rd is a home located in St. Clair County with nearby schools including Schaefer Elementary School, Fulton Junior High School, and O'Fallon Township High School.
Ownership History
Date
Name
Owned For
Owner Type
Purchase Details
Closed on
May 18, 2020
Sold by
Comerford Jeffrey C and Comerford Susan R
Bought by
Comerford Jeffrey C and Comerford Susan R
Current Estimated Value
Home Financials for this Owner
Home Financials are based on the most recent Mortgage that was taken out on this home.
Original Mortgage
$176,000
Outstanding Balance
$156,165
Interest Rate
3.37%
Mortgage Type
New Conventional
Estimated Equity
$279,175
Purchase Details
Closed on
May 25, 2018
Sold by
Comerford Jeffrey C and Comerford Susan
Bought by
Comerford Jeffrey C and Comerford Susan R
Purchase Details
Closed on
Aug 25, 2008
Sold by
Brown Grover C and Brown Jennifer S E
Bought by
Comerford Jeffrey C and Comerford Susan R
Home Financials for this Owner
Home Financials are based on the most recent Mortgage that was taken out on this home.
Original Mortgage
$192,000
Interest Rate
6.31%
Mortgage Type
Purchase Money Mortgage
Create a Home Valuation Report for This Property
The Home Valuation Report is an in-depth analysis detailing your home's value as well as a comparison with similar homes in the area
Home Values in the Area
Average Home Value in this Area
Purchase History
| Date | Buyer | Sale Price | Title Company |
|---|---|---|---|
| Comerford Jeffrey C | -- | Benchmark Title Co | |
| Comerford Jeffrey C | -- | None Available | |
| Comerford Jeffrey C | $240,000 | Freedom Title |
Source: Public Records
Mortgage History
| Date | Status | Borrower | Loan Amount |
|---|---|---|---|
| Open | Comerford Jeffrey C | $176,000 | |
| Closed | Comerford Jeffrey C | $192,000 |
Source: Public Records
Tax History Compared to Growth
Tax History
| Year | Tax Paid | Tax Assessment Tax Assessment Total Assessment is a certain percentage of the fair market value that is determined by local assessors to be the total taxable value of land and additions on the property. | Land | Improvement |
|---|---|---|---|---|
| 2024 | $7,515 | $114,089 | $23,776 | $90,313 |
| 2023 | $6,838 | $101,259 | $21,102 | $80,157 |
| 2022 | $6,398 | $93,095 | $19,401 | $73,694 |
| 2021 | $6,901 | $92,929 | $19,463 | $73,466 |
| 2020 | $6,845 | $87,966 | $18,424 | $69,542 |
| 2019 | $6,681 | $87,966 | $18,424 | $69,542 |
| 2018 | $6,495 | $85,412 | $17,889 | $67,523 |
| 2017 | $3,449 | $86,973 | $18,652 | $68,321 |
| 2016 | $6,850 | $84,943 | $18,217 | $66,726 |
| 2014 | $3,164 | $83,960 | $18,006 | $65,954 |
| 2013 | $6,023 | $82,672 | $17,730 | $64,942 |
Source: Public Records
Map
Nearby Homes
- 1413 Schwarz Meadow Dr
- 1243 Wayne Ct
- 14 Shallowbrook Dr
- 101 E Brittany Ln
- 108 Chickasaw Ln
- 0 Glen Hollow Dr
- 518 Deer Creek Rd
- 1215 Marshal Ct
- 814 W Lakeshore Dr
- 171 Picketts Run
- 320 Dewitt Ct
- 326 Dewitt Ct
- 1183 Tazewell Dr
- 1214 Applewhite Rd
- 1551 N Parc Grove Ct
- 104 W Jackson St
- 109 Callaway Ct
- 805 Belpre Dr
- 1031 Shadow Ridge Crossing
- 809 E Deer Creek Rd
- 209 W Deer Creek Rd
- 217 W Deer Creek Rd
- 205 W Deer Creek Rd
- 218 Fieldspring Ct
- 222 Fieldspring Ct
- 221 W Deer Creek Rd
- 218 W Deer Creek Rd
- 214 W Deer Creek Rd
- 226 Fieldspring Ct
- 1205 Bossler Ln
- 210 W Deer Creek Rd
- 1302 Haps Ln
- 1209 Bossler Ln
- 230 Fieldspring Ct
- 225 W Deer Creek Rd
- 214 Fieldspring Ct
- 1213 Bossler Ln
- 1201 Bossler Ln
- 206 W Deer Creek Rd
- 236 Fieldspring Ct