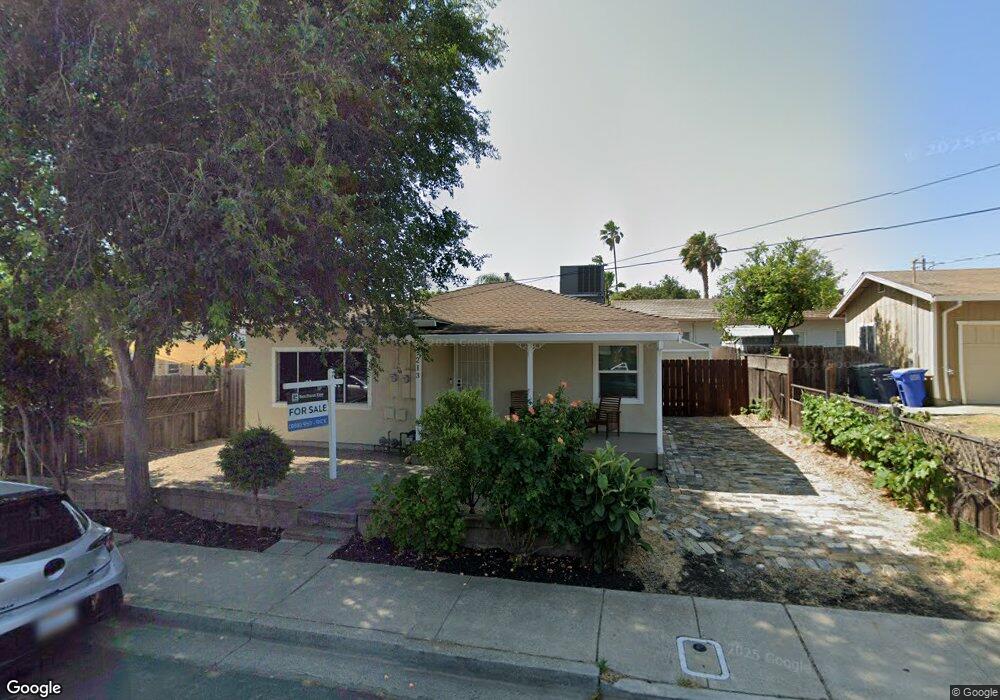
213 W Ruby St Oakley, CA 94561
Estimated Value: $230,000 - $362,926
2
Beds
1
Bath
858
Sq Ft
$333/Sq Ft
Est. Value
About This Home
This home is located at 213 W Ruby St, Oakley, CA 94561 and is currently estimated at $285,642, approximately $332 per square foot. 213 W Ruby St is a home located in Contra Costa County with nearby schools including Oakley Elementary School, O'Hara Park Middle School, and Freedom High School.
Ownership History
Date
Name
Owned For
Owner Type
Purchase Details
Closed on
Jan 11, 2024
Sold by
Buzi Jason
Bought by
Linxu Investment Llc
Current Estimated Value
Purchase Details
Closed on
Nov 23, 2023
Sold by
Zca Homes Llc
Bought by
Buzi Jason
Purchase Details
Closed on
Nov 22, 2023
Sold by
Ginger Marie Campbell Revocable Living T and Campbell Ginger M
Bought by
Zca Homes Llc
Create a Home Valuation Report for This Property
The Home Valuation Report is an in-depth analysis detailing your home's value as well as a comparison with similar homes in the area
Home Values in the Area
Average Home Value in this Area
Purchase History
| Date | Buyer | Sale Price | Title Company |
|---|---|---|---|
| Linxu Investment Llc | $266,000 | Wfg National Title Insurance C | |
| Buzi Jason | -- | Wfg National Title Insurance C | |
| Buzi Jason | $179,000 | Wfg National Title Insurance C | |
| Zca Homes Llc | $150,000 | Wfg National Title Insurance C |
Source: Public Records
Tax History
| Year | Tax Paid | Tax Assessment Tax Assessment Total Assessment is a certain percentage of the fair market value that is determined by local assessors to be the total taxable value of land and additions on the property. | Land | Improvement |
|---|---|---|---|---|
| 2025 | $4,362 | $271,320 | $239,700 | $31,620 |
| 2024 | $3,941 | $266,000 | $235,000 | $31,000 |
| 2023 | $1,305 | $24,361 | $15,066 | $9,295 |
| 2022 | $1,225 | $23,884 | $14,771 | $9,113 |
| 2021 | $1,178 | $23,417 | $14,482 | $8,935 |
| 2019 | $959 | $22,724 | $14,053 | $8,671 |
| 2018 | $952 | $22,279 | $13,778 | $8,501 |
| 2017 | $948 | $21,843 | $13,508 | $8,335 |
| 2016 | $925 | $21,416 | $13,244 | $8,172 |
| 2015 | -- | $21,096 | $13,046 | $8,050 |
| 2014 | $901 | $20,684 | $12,791 | $7,893 |
Source: Public Records
Map
Nearby Homes
- 201 Ohara Ave
- 4730 Duarte Ave
- 1 Bradford Island Rd
- 4620 Duarte Ave
- 1109 Deerpark Rd
- 1104 Jordan Ln
- 0 Main St Unit 41115212
- 4920 Dawson Dr
- 0 Almond Dr Unit 41106452
- 912 Rhine Way
- 4855 Edgewood Ct
- 215 Spindrift Ct
- 633 Country Ln
- 459 Hazelnut Dr
- 1859 Santa fe St
- 641 Woodbury Place
- 330 W Cypress Rd
- 1765 Delta Meadows Way
- 876 Diamante Way
- 409 Hazelnut Dr
Your Personal Tour Guide
Ask me questions while you tour the home.