Estimated Value: $439,000 - $707,000
3
Beds
2
Baths
2,143
Sq Ft
$290/Sq Ft
Est. Value
About This Home
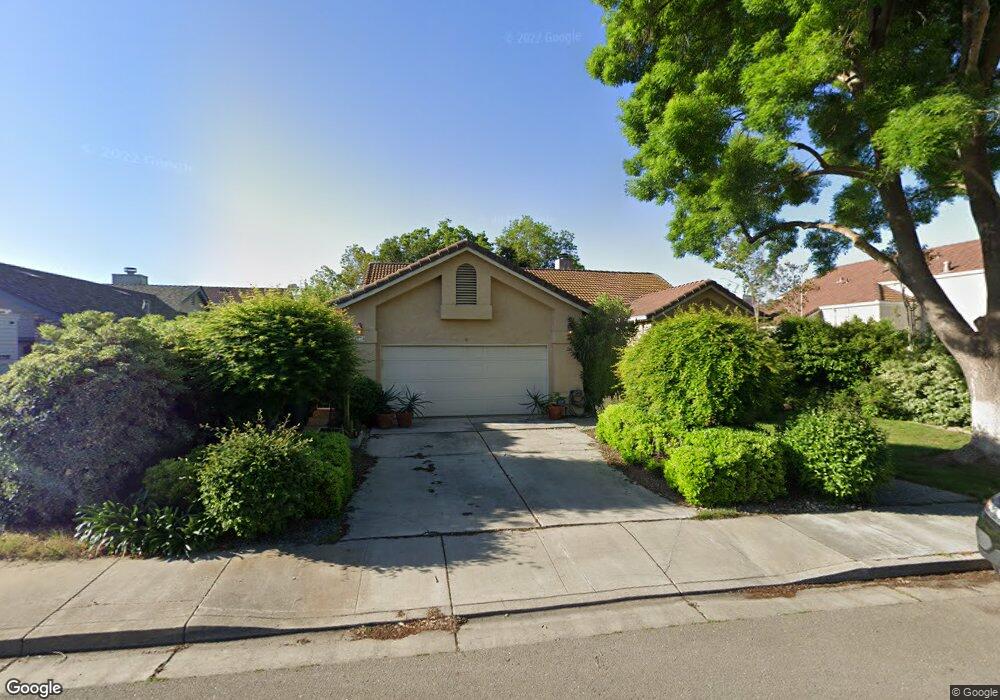
This home is located at 2130 Hillcrest Dr, Tracy, CA 95377 and is currently estimated at $621,894, approximately $290 per square foot. 2130 Hillcrest Dr is a home located in San Joaquin County with nearby schools including Art Freiler, Merrill F. West High School, and Tracy Independent Study Charter School.
Ownership History
Date
Name
Owned For
Owner Type
Purchase Details
Closed on
Jun 21, 2022
Sold by
Keating and Kim
Bought by
Keating Family Trust
Current Estimated Value
Purchase Details
Closed on
May 5, 2008
Sold by
Reed Rose D and Mcclelland Nancy A
Bought by
Keating Robert and Keating Kim
Home Financials for this Owner
Home Financials are based on the most recent Mortgage that was taken out on this home.
Original Mortgage
$239,950
Interest Rate
5.8%
Mortgage Type
Purchase Money Mortgage
Purchase Details
Closed on
Oct 24, 2003
Sold by
Reed Rose D and Milton W & Rose D Reed 1989 Tr
Bought by
Reed Rose D and Mcclelland Nancy A
Purchase Details
Closed on
Oct 20, 1998
Sold by
William Kalbfleisch
Bought by
Reed Milton W and Reed Rose D
Create a Home Valuation Report for This Property
The Home Valuation Report is an in-depth analysis detailing your home's value as well as a comparison with similar homes in the area
Home Values in the Area
Average Home Value in this Area
Purchase History
| Date | Buyer | Sale Price | Title Company |
|---|---|---|---|
| Keating Family Trust | -- | None Listed On Document | |
| Keating Robert | $300,000 | Old Republic Title Company | |
| Reed Rose D | -- | Old Republic Title Company | |
| Reed Rose D | -- | -- | |
| Reed Milton W | $210,000 | Old Republic Title Company |
Source: Public Records
Mortgage History
| Date | Status | Borrower | Loan Amount |
|---|---|---|---|
| Previous Owner | Keating Robert | $239,950 |
Source: Public Records
Tax History
| Year | Tax Paid | Tax Assessment Tax Assessment Total Assessment is a certain percentage of the fair market value that is determined by local assessors to be the total taxable value of land and additions on the property. | Land | Improvement |
|---|---|---|---|---|
| 2025 | $4,491 | $382,146 | $133,969 | $248,177 |
| 2024 | $4,144 | $374,654 | $131,343 | $243,311 |
| 2023 | $4,077 | $367,309 | $128,768 | $238,541 |
| 2022 | $3,991 | $360,108 | $126,244 | $233,864 |
| 2021 | $3,941 | $353,048 | $123,769 | $229,279 |
| 2020 | $3,913 | $349,429 | $122,500 | $226,929 |
| 2019 | $3,848 | $342,579 | $120,099 | $222,480 |
| 2018 | $4,023 | $335,863 | $117,745 | $218,118 |
| 2017 | $3,835 | $329,279 | $115,437 | $213,842 |
| 2016 | $3,866 | $322,823 | $113,174 | $209,649 |
| 2014 | $3,642 | $311,750 | $109,292 | $202,458 |
Source: Public Records
Map
Nearby Homes
- 1890 Spring Valley Way
- 2231 Hillcrest Dr
- 1861 Mcpeak Ct
- 1974 Paradise Valley Ct
- 2306 Sabrina Way
- 2431 Ogden Sannazor Ct
- 1533 Vinewood Way
- 1677 Green Springs Ct
- 1233 Plaza Ct
- 1463 Evergreen Ct
- 1706 Countrywood Ln
- 2488 Gaines Ln
- 1651 W Beverly Place
- 1830 Laurelgrove Ln
- 8300 W 11th St
- 2919 Kennsington Ln
- 1416 Audrey Dr
- 2902 Campbell Ln
- 2988 Kennsington Ct
- 2963 Rugby Ct
- 2110 Hillcrest Dr
- 2140 Hillcrest Dr
- 2105 Jenni Ln
- 2115 Jenni Ln
- 2085 Jenni Ln
- 2125 Jenni Ln
- 2150 Hillcrest Dr
- 2135 Jenni Ln
- 2160 Hillcrest Dr
- 1880 Spring Valley Way
- 1870 Spring Valley Way
- 2065 Jenni Ln
- 2145 Jenni Ln
- 2151 Hillcrest Dr
- 1920 Ridgemont Way
- 1921 Spring Valley Way
- 1900 Spring Valley Way
- 2170 Hillcrest Dr
- 2055 Jenni Ln
- 2100 Jenni Ln