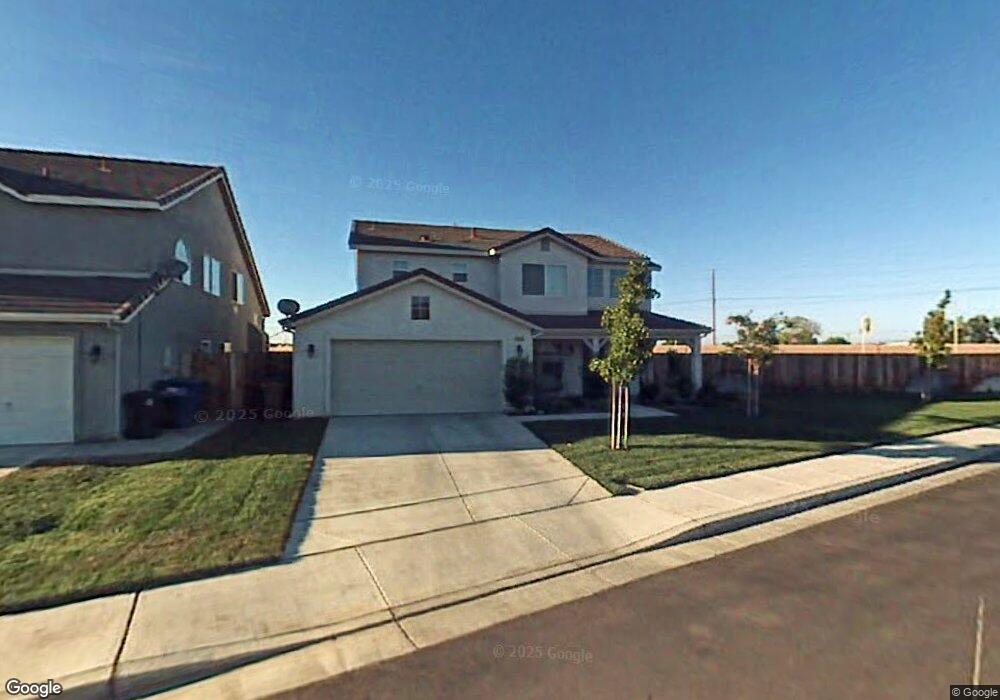
2130 W Rock Creek Ct Merced, CA 95348
Franklin NeighborhoodEstimated Value: $398,000 - $418,535
4
Beds
3
Baths
1,938
Sq Ft
$209/Sq Ft
Est. Value
About This Home
This home is located at 2130 W Rock Creek Ct, Merced, CA 95348 and is currently estimated at $405,884, approximately $209 per square foot. 2130 W Rock Creek Ct is a home located in Merced County with nearby schools including Franklin Elementary School, Rudolph Rivera Middle School, and Buhach Colony High School.
Ownership History
Date
Name
Owned For
Owner Type
Purchase Details
Closed on
Aug 14, 2024
Sold by
Sweeleh Khaled and Mohamed Saba
Bought by
Sweeleh Khaled and Mohamed Saba
Current Estimated Value
Purchase Details
Closed on
Oct 9, 2009
Sold by
Litton Loan Servicing Lp
Bought by
Saba Sweeleh Khaled and Saba Mohamed
Home Financials for this Owner
Home Financials are based on the most recent Mortgage that was taken out on this home.
Original Mortgage
$132,554
Interest Rate
4.83%
Mortgage Type
FHA
Purchase Details
Closed on
Jun 30, 2009
Sold by
Aguilar David
Bought by
Litton Loan Servicing Lp
Purchase Details
Closed on
Oct 12, 2006
Sold by
El Capitan Estates Llc
Bought by
Aguilar David
Home Financials for this Owner
Home Financials are based on the most recent Mortgage that was taken out on this home.
Original Mortgage
$290,129
Interest Rate
5.94%
Mortgage Type
Purchase Money Mortgage
Create a Home Valuation Report for This Property
The Home Valuation Report is an in-depth analysis detailing your home's value as well as a comparison with similar homes in the area
Home Values in the Area
Average Home Value in this Area
Purchase History
| Date | Buyer | Sale Price | Title Company |
|---|---|---|---|
| Sweeleh Khaled | -- | None Listed On Document | |
| Saba Sweeleh Khaled | $135,000 | Fidelity National Title Co | |
| Litton Loan Servicing Lp | $110,500 | None Available | |
| Aguilar David | $363,000 | Transcounty Title Company |
Source: Public Records
Mortgage History
| Date | Status | Borrower | Loan Amount |
|---|---|---|---|
| Previous Owner | Saba Sweeleh Khaled | $132,554 | |
| Previous Owner | Aguilar David | $290,129 |
Source: Public Records
Tax History Compared to Growth
Tax History
| Year | Tax Paid | Tax Assessment Tax Assessment Total Assessment is a certain percentage of the fair market value that is determined by local assessors to be the total taxable value of land and additions on the property. | Land | Improvement |
|---|---|---|---|---|
| 2025 | $1,926 | $174,247 | $19,355 | $154,892 |
| 2024 | $1,926 | $170,831 | $18,976 | $151,855 |
| 2023 | $1,901 | $167,482 | $18,604 | $148,878 |
| 2022 | $1,875 | $164,199 | $18,240 | $145,959 |
| 2021 | $1,870 | $160,981 | $17,883 | $143,098 |
| 2020 | $1,882 | $159,331 | $17,700 | $141,631 |
| 2019 | $1,855 | $156,207 | $17,353 | $138,854 |
| 2018 | $1,704 | $153,145 | $17,013 | $136,132 |
| 2017 | $1,761 | $150,143 | $16,680 | $133,463 |
| 2016 | $1,735 | $147,200 | $16,353 | $130,847 |
| 2015 | $1,709 | $144,990 | $16,108 | $128,882 |
| 2014 | $1,674 | $142,151 | $15,793 | $126,358 |
Source: Public Records
Map
Nearby Homes
- 2868 Beachwood Dr
- 2329 Dan Ward Rd
- 2989 Maple Ave
- 2864 Elm Ave
- 2394 Dan Ward Rd
- 2429 Elderberry Dr
- 2931 Elm Ave
- 2923 Elm Ave
- 2125 W Antley St
- 2136 W Chesler St
- 2139 W Chesler St
- 2052 W Solis St
- 2443 Fern St
- 2153 W Solis St
- 2574 Pinedale Ave
- 2094 W Pincay St
- 2577 Lobo Ave
- 2341 Mesquite Ct
- 2290 Fern St
- 2152 Fern St
- 2116 W Rock Creek Ct
- 2144 W Rock Creek Ct
- 2835 N Drake Ave
- 2823 N Drake Ave
- 2839 Drake Ave
- 2143 W Drake Ave
- 2154 W Rock Creek Ct
- 2817 N Drake Ave
- 2131 W Rock Creek Ct
- 2143 W Rock Creek Ct
- 2155 W Drake Ave
- 2101 W Rock Creek Ct
- 2813 N Drake Ave
- 2107 W Rock Creek Ct
- 2168 W Rock Creek Ct
- 2155 W Rock Creek Ct
- 2167 W Drake Ave
- 2840 N Drake Ave
- 2852 N Drake Ave