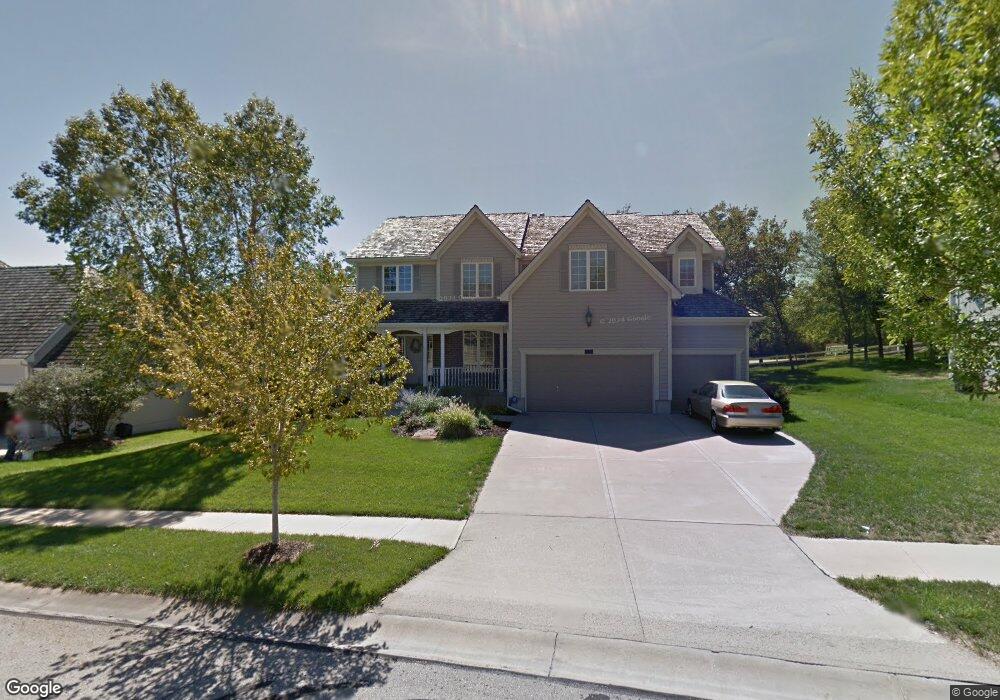
21301 W 82nd St Lenexa, KS 66220
Estimated Value: $577,000 - $726,192
4
Beds
4
Baths
3,255
Sq Ft
$203/Sq Ft
Est. Value
About This Home
This home is located at 21301 W 82nd St, Lenexa, KS 66220 and is currently estimated at $660,548, approximately $202 per square foot. 21301 W 82nd St is a home located in Johnson County with nearby schools including Horizon Elementary School, Mill Creek Middle School, and Mill Valley High School.
Ownership History
Date
Name
Owned For
Owner Type
Purchase Details
Closed on
Sep 6, 2007
Sold by
West James W and Velle West Lisa Marie
Bought by
Chaverin Daniel L and Chaverin Leslie A
Current Estimated Value
Purchase Details
Closed on
Aug 28, 2003
Sold by
The Plantation Llc
Bought by
West James and Veile West Lisa M
Home Financials for this Owner
Home Financials are based on the most recent Mortgage that was taken out on this home.
Original Mortgage
$318,250
Interest Rate
5.37%
Mortgage Type
Purchase Money Mortgage
Purchase Details
Closed on
Dec 12, 2002
Sold by
Holsinger Homes Llc
Bought by
Plantation Llc
Create a Home Valuation Report for This Property
The Home Valuation Report is an in-depth analysis detailing your home's value as well as a comparison with similar homes in the area
Home Values in the Area
Average Home Value in this Area
Purchase History
| Date | Buyer | Sale Price | Title Company |
|---|---|---|---|
| Chaverin Daniel L | -- | First American Title Ins Co | |
| West James | -- | Kansas Title Ins Corp | |
| Plantation Llc | -- | Kansas Title Ins Corp |
Source: Public Records
Mortgage History
| Date | Status | Borrower | Loan Amount |
|---|---|---|---|
| Previous Owner | West James | $318,250 |
Source: Public Records
Tax History Compared to Growth
Tax History
| Year | Tax Paid | Tax Assessment Tax Assessment Total Assessment is a certain percentage of the fair market value that is determined by local assessors to be the total taxable value of land and additions on the property. | Land | Improvement |
|---|---|---|---|---|
| 2024 | $7,775 | $64,216 | $11,761 | $52,455 |
| 2023 | $6,949 | $56,614 | $11,761 | $44,853 |
| 2022 | $6,948 | $55,648 | $10,228 | $45,420 |
| 2021 | $6,386 | $49,680 | $10,228 | $39,452 |
| 2020 | $6,311 | $48,794 | $9,301 | $39,493 |
| 2019 | $5,806 | $44,229 | $9,301 | $34,928 |
| 2018 | $6,156 | $46,310 | $9,301 | $37,009 |
| 2017 | $6,044 | $43,758 | $7,750 | $36,008 |
| 2016 | $6,214 | $44,471 | $7,380 | $37,091 |
| 2015 | $6,489 | $44,666 | $7,380 | $37,286 |
| 2013 | -- | $38,617 | $7,380 | $31,237 |
Source: Public Records
Map
Nearby Homes
- The Brookridge IV Plan at Bristol Highlands - The Estates
- The Courtland Reverse Plan at Bristol Highlands - The Estates
- The Madison II Plan at Bristol Highlands - The Estates
- 8005 Millridge St
- 21513 W 80th Terrace
- 21615 W 80th Terrace
- 8013 Millridge St
- 17104 Earnshaw St
- 8001 Millridge St
- The Timberland Exp Plan at Bristol Highlands - The Manors
- The Kinsley Plan at Bristol Highlands - The Manors
- Newport Plan at Bristol Highlands - The Twin Villas
- The Capri Plan at Bristol Highlands - The Manors
- The Morgan Plan at Bristol Highlands - The Manors
- The Kendyl Reverse Plan at Bristol Highlands - The Manors
- The Austyn Reverse Plan at Bristol Highlands - The Manors
- The Hudson Plan at Bristol Highlands - The Manors
- The Mackenzie Expanded Plan at Bristol Highlands - The Manors
- The Hansen Plan at Bristol Highlands - The Manors
- The Timberland Reverse Plan at Bristol Highlands - The Manors
- 21307 W 82nd St
- 21215 W 82nd St
- 21209 W 82nd St
- 21218 W 82nd St
- 21306 W 82nd St
- 21212 W 82nd St
- 21312 W 82nd St
- 21203 W 82nd St
- 21206 W 82nd St
- 21316 W 82nd St
- 21303 W 81st Place
- 21200 W 82nd St
- 21307 W 81st Place
- 21221 W 81st Place
- 21320 W 82nd St
- 21215 W 81st Place
- 8222 Deer Run St
- 21311 W 81st Place
- 21205 W 81st Place
- 8153 Deer Run St