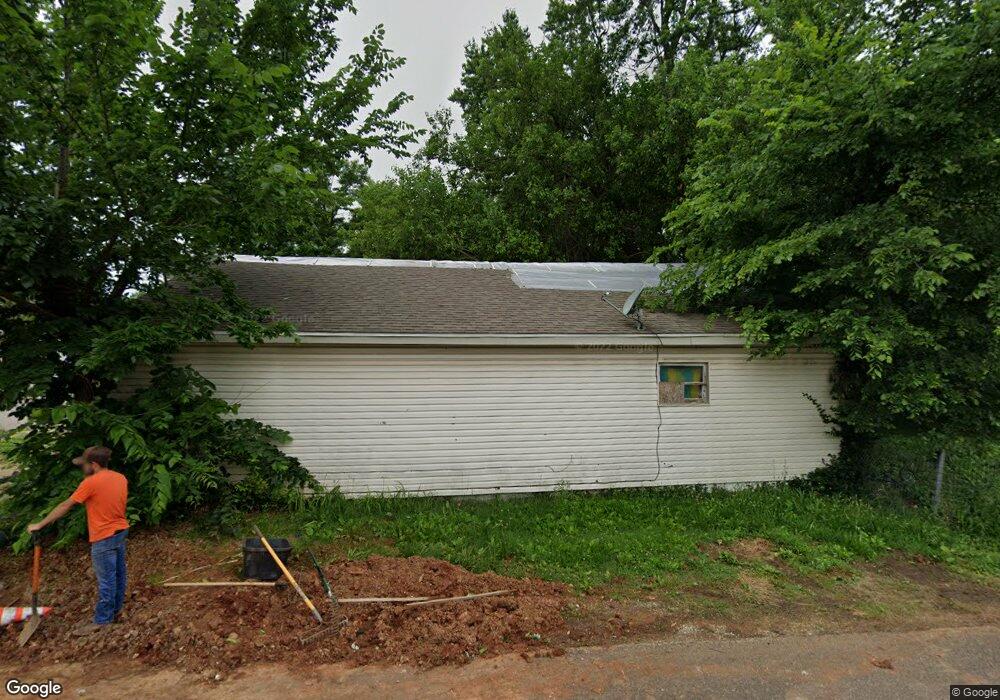
2131 W Atlantic St Springfield, MO 65803
Tom Watkins NeighborhoodEstimated Value: $134,406 - $192,000
4
Beds
2
Baths
1,670
Sq Ft
$101/Sq Ft
Est. Value
About This Home
This home is located at 2131 W Atlantic St, Springfield, MO 65803 and is currently estimated at $168,352, approximately $100 per square foot. 2131 W Atlantic St is a home located in Greene County with nearby schools including Williams Elementary School, Reed Academy, and Hillcrest High School.
Ownership History
Date
Name
Owned For
Owner Type
Purchase Details
Closed on
Dec 17, 2025
Sold by
Tc Portfolio Llc
Bought by
Homestead Asset Holdings Llc
Current Estimated Value
Home Financials for this Owner
Home Financials are based on the most recent Mortgage that was taken out on this home.
Original Mortgage
$120,000
Outstanding Balance
$120,000
Interest Rate
6.24%
Mortgage Type
Credit Line Revolving
Estimated Equity
$48,352
Purchase Details
Closed on
Nov 12, 2025
Sold by
Tc Portfolio Llc
Bought by
Homestead Asset Holdings Llc
Home Financials for this Owner
Home Financials are based on the most recent Mortgage that was taken out on this home.
Original Mortgage
$120,000
Outstanding Balance
$120,000
Interest Rate
6.24%
Mortgage Type
Credit Line Revolving
Estimated Equity
$48,352
Purchase Details
Closed on
Mar 11, 2021
Sold by
417 Rentals Llc
Bought by
Greater Ozarks Real Estate Holdings Lp
Purchase Details
Closed on
Nov 18, 2008
Sold by
Accredited Home Lenders Inc
Bought by
417 Rentals Llc
Purchase Details
Closed on
Aug 14, 2008
Sold by
Walker Charles and Walker Linda
Bought by
Accredited Home Lenders Inc
Purchase Details
Closed on
Jul 20, 2006
Sold by
Walker Charles E
Bought by
Walker Linda F
Purchase Details
Closed on
Jan 21, 2005
Sold by
Berkowitz Mike and Berkowitz Pam
Bought by
Walker Charles and Walker Linda
Home Financials for this Owner
Home Financials are based on the most recent Mortgage that was taken out on this home.
Original Mortgage
$44,000
Interest Rate
5.68%
Mortgage Type
Future Advance Clause Open End Mortgage
Create a Home Valuation Report for This Property
The Home Valuation Report is an in-depth analysis detailing your home's value as well as a comparison with similar homes in the area
Home Values in the Area
Average Home Value in this Area
Purchase History
| Date | Buyer | Sale Price | Title Company |
|---|---|---|---|
| Homestead Asset Holdings Llc | -- | First Integrity Title | |
| Homestead Asset Holdings Llc | -- | First Integrity Title | |
| Greater Ozarks Real Estate Holdings Lp | $57,000 | None Available | |
| 417 Rentals Llc | -- | None Available | |
| Accredited Home Lenders Inc | $42,500 | None Available | |
| Walker Linda F | -- | None Available | |
| Walker Charles | -- | None Available |
Source: Public Records
Mortgage History
| Date | Status | Borrower | Loan Amount |
|---|---|---|---|
| Open | Homestead Asset Holdings Llc | $120,000 | |
| Previous Owner | Homestead Asset Holdings Llc | $116,000 | |
| Previous Owner | Walker Charles | $44,000 |
Source: Public Records
Tax History
| Year | Tax Paid | Tax Assessment Tax Assessment Total Assessment is a certain percentage of the fair market value that is determined by local assessors to be the total taxable value of land and additions on the property. | Land | Improvement |
|---|---|---|---|---|
| 2025 | $706 | $14,170 | $2,850 | $11,320 |
| 2024 | $663 | $12,350 | $1,900 | $10,450 |
| 2023 | $659 | $12,350 | $1,900 | $10,450 |
| 2022 | $566 | $10,370 | $1,900 | $8,470 |
| 2021 | $566 | $10,370 | $1,900 | $8,470 |
| 2020 | $547 | $9,580 | $1,900 | $7,680 |
| 2019 | $1,160 | $9,580 | $1,900 | $7,680 |
| 2018 | $492 | $8,870 | $1,900 | $6,970 |
| 2017 | $487 | $8,870 | $1,900 | $6,970 |
| 2016 | $486 | $8,870 | $1,900 | $6,970 |
| 2015 | $482 | $8,870 | $1,900 | $6,970 |
| 2014 | $485 | $8,870 | $1,900 | $6,970 |
Source: Public Records
Map
Nearby Homes
- 2104 N Park Ave
- 2009 N Park Ave
- 2119 N Marion Ave
- 1956 W Atlantic St
- 2130 N Park Ave
- 2020 N Columbia Ave
- 2101 N Grace Ave
- 2105 N Elizabeth Ave
- 2111 N Elizabeth Ave
- 2074 N Columbia Ave
- 2406 W High St
- 2130 N Elizabeth Ave
- 2237 N Park Ave
- 2217 N Grace Ave
- Lot 1 N Grace Ave
- Lot 13 N Grace Ave
- Lot 3 N Grace Ave
- Lot 2 N Grace Ave
- 2117 N Lexington Ave
- 1700 W Atlantic St
- 2135 W Atlantic St
- 2123 W Atlantic St
- 2013 N Hoffman Ave
- 2141 W Atlantic St
- 2117 W Atlantic St
- 2019 N Hoffman Ave
- 0 N Park Ave
- 3200 N Park Ave
- 3052 N Park Ave
- 2142 W Atlantic St
- 2018 N Hoffman Ave
- 2136 W Atlantic St
- 2025 N Hoffman Ave
- 2004 N Park Ave
- 2126 W Atlantic St
- 2000 N Park Ave
- 2010 N Park Ave
- 2113 W Atlantic St
- 2014 N Park Ave
- 2120 W Atlantic St
Your Personal Tour Guide
Ask me questions while you tour the home.