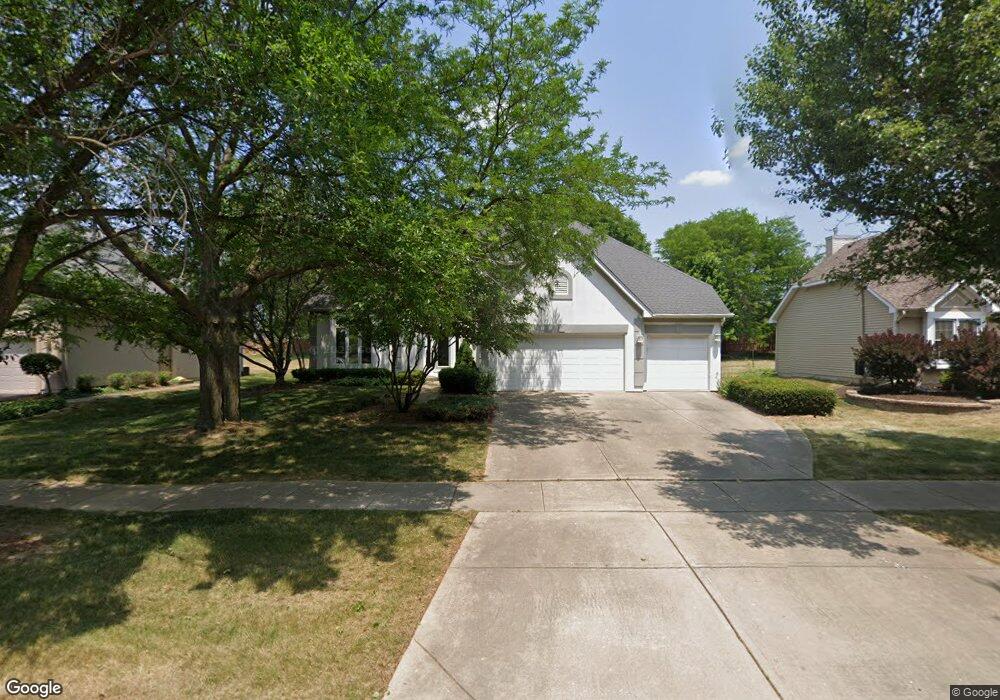
2131 Yellowstar Ln Naperville, IL 60564
High Meadow NeighborhoodEstimated Value: $635,000 - $663,000
Studio
1
Bath
2,763
Sq Ft
$235/Sq Ft
Est. Value
About This Home
This home is located at 2131 Yellowstar Ln, Naperville, IL 60564 and is currently estimated at $649,526, approximately $235 per square foot. 2131 Yellowstar Ln is a home located in Will County with nearby schools including Graham Elementary School, Clifford Crone Middle School, and Neuqua Valley High School.
Ownership History
Date
Name
Owned For
Owner Type
Purchase Details
Closed on
Nov 23, 2016
Sold by
Harms Fred D
Bought by
Harms Fred D and Harms Linda
Current Estimated Value
Home Financials for this Owner
Home Financials are based on the most recent Mortgage that was taken out on this home.
Original Mortgage
$589,500
Interest Rate
3.87%
Mortgage Type
Reverse Mortgage Home Equity Conversion Mortgage
Purchase Details
Closed on
May 16, 2014
Sold by
Harms Fred D and Harms Linda L
Bought by
Harms Fred D
Home Financials for this Owner
Home Financials are based on the most recent Mortgage that was taken out on this home.
Original Mortgage
$543,000
Interest Rate
2.4%
Mortgage Type
Reverse Mortgage Home Equity Conversion Mortgage
Purchase Details
Closed on
Mar 27, 2007
Sold by
Harms Fred D
Bought by
Harms Fred D and Harms Linda L
Home Financials for this Owner
Home Financials are based on the most recent Mortgage that was taken out on this home.
Original Mortgage
$70,000
Interest Rate
6.18%
Mortgage Type
New Conventional
Create a Home Valuation Report for This Property
The Home Valuation Report is an in-depth analysis detailing your home's value as well as a comparison with similar homes in the area
Home Values in the Area
Average Home Value in this Area
Purchase History
| Date | Buyer | Sale Price | Title Company |
|---|---|---|---|
| Harms Fred D | -- | Attorney | |
| Harms Fred D | -- | Fnc Title Services Llc | |
| Harms Fred D | -- | Chicago Title Insurance Comp |
Source: Public Records
Mortgage History
| Date | Status | Borrower | Loan Amount |
|---|---|---|---|
| Closed | Harms Fred D | $589,500 | |
| Closed | Harms Fred D | $543,000 | |
| Closed | Harms Fred D | $70,000 |
Source: Public Records
Tax History
| Year | Tax Paid | Tax Assessment Tax Assessment Total Assessment is a certain percentage of the fair market value that is determined by local assessors to be the total taxable value of land and additions on the property. | Land | Improvement |
|---|---|---|---|---|
| 2024 | $11,938 | $198,262 | $52,673 | $145,589 |
| 2023 | $11,938 | $175,143 | $46,531 | $128,612 |
| 2022 | $8,810 | $165,544 | $44,017 | $121,527 |
| 2021 | $8,857 | $157,661 | $41,921 | $115,740 |
| 2020 | $8,834 | $155,163 | $41,257 | $113,906 |
| 2019 | $8,945 | $150,790 | $40,094 | $110,696 |
| 2018 | $9,109 | $148,465 | $39,212 | $109,253 |
| 2017 | $9,217 | $144,633 | $38,200 | $106,433 |
| 2016 | $9,411 | $141,520 | $37,378 | $104,142 |
| 2015 | $10,169 | $136,077 | $35,940 | $100,137 |
| 2014 | $10,169 | $132,598 | $35,940 | $96,658 |
| 2013 | $10,169 | $132,598 | $35,940 | $96,658 |
Source: Public Records
Map
Nearby Homes
- 4711 Snapjack Cir
- 4507 Barr Creek Ln
- 2703 Wait Rd Unit 3
- 5719 Rosinweed Ln
- 2836 Fairhauser Ct
- 2255 Wendt Cir
- 2419 Lawlor Ln
- 2423 Lawlor Ln
- 2519 Mallet Ct
- 2427 Lawlor Ln
- 2515 Mallet Ct
- 2316 Spur Rd
- 2543 Mallet Ct
- 2547 Mallet Ct
- 5904 Hawkweed Dr Unit 7402
- 5902 Hawkweed Dr Unit 7401
- 2318 Horseshoe Cir Unit 8802
- 2607 Lawlor Ln
- 2317 Horseshoe Cir Unit 10202
- 2312 Horseshoe Cir Unit 8805
- 2135 Yellowstar Ln
- 2127 Yellowstar Ln
- 2139 Yellowstar Ln
- 2123 Yellowstar Ln
- 2132 Yellowstar Ln
- 2128 Yellowstar Ln
- 2119 Yellowstar Ln
- 2153 Yellowstar Ln
- 4760 Snapjack Cir
- 2143 Yellowstar Ln
- 2124 Yellowstar Ln Unit 2
- 4764 Snapjack Cir
- 4768 Snapjack Cir
- 4772 Snapjack Cir
- 2115 Yellowstar Ln
- 2147 Yellowstar Ln
- 4756 Snapjack Cir
- 2156 Yellowstar Ln
- 4776 Snapjack Cir
- 2116 Yellowstar Ln
Your Personal Tour Guide
Ask me questions while you tour the home.