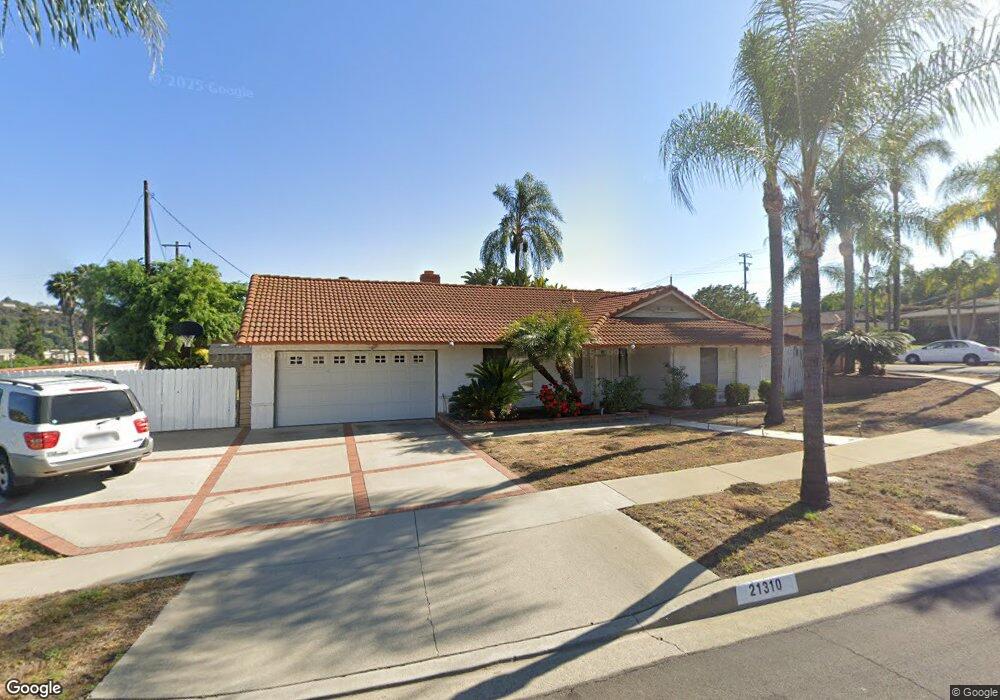
21310 Hidden Pines Dr Diamond Bar, CA 91765
Estimated Value: $910,927 - $1,114,000
3
Beds
2
Baths
1,300
Sq Ft
$749/Sq Ft
Est. Value
About This Home
This home is located at 21310 Hidden Pines Dr, Diamond Bar, CA 91765 and is currently estimated at $973,732, approximately $749 per square foot. 21310 Hidden Pines Dr is a home located in Los Angeles County with nearby schools including Castle Rock Elementary School, South Pointe Middle School, and Diamond Bar High School.
Ownership History
Date
Name
Owned For
Owner Type
Purchase Details
Closed on
Aug 29, 2011
Sold by
Fang David C and Fang Susan S
Bought by
Chung Ria
Current Estimated Value
Home Financials for this Owner
Home Financials are based on the most recent Mortgage that was taken out on this home.
Original Mortgage
$340,800
Outstanding Balance
$233,378
Interest Rate
4.26%
Mortgage Type
New Conventional
Estimated Equity
$740,354
Purchase Details
Closed on
Jan 5, 2006
Sold by
Aquino Filomena V and The Filomena V Aquino Trust
Bought by
Fang David C and Fang Susan S
Home Financials for this Owner
Home Financials are based on the most recent Mortgage that was taken out on this home.
Original Mortgage
$416,250
Interest Rate
6.28%
Mortgage Type
Fannie Mae Freddie Mac
Purchase Details
Closed on
Jun 17, 2004
Sold by
Aquino Filomena V
Bought by
Aquino Filomena V and The Filomena V Aquino Trust
Purchase Details
Closed on
Aug 3, 1998
Sold by
Cross Theodore W and Cross Melinda L
Bought by
Aquino Filomena V
Home Financials for this Owner
Home Financials are based on the most recent Mortgage that was taken out on this home.
Original Mortgage
$159,200
Interest Rate
6.93%
Create a Home Valuation Report for This Property
The Home Valuation Report is an in-depth analysis detailing your home's value as well as a comparison with similar homes in the area
Home Values in the Area
Average Home Value in this Area
Purchase History
| Date | Buyer | Sale Price | Title Company |
|---|---|---|---|
| Chung Ria | $426,000 | Advantage Title Inc | |
| Fang David C | $555,000 | Southland Title Corporation | |
| Aquino Filomena V | -- | -- | |
| Aquino Filomena V | $199,000 | Gateway Title Company |
Source: Public Records
Mortgage History
| Date | Status | Borrower | Loan Amount |
|---|---|---|---|
| Open | Chung Ria | $340,800 | |
| Previous Owner | Fang David C | $416,250 | |
| Previous Owner | Aquino Filomena V | $159,200 |
Source: Public Records
Tax History Compared to Growth
Tax History
| Year | Tax Paid | Tax Assessment Tax Assessment Total Assessment is a certain percentage of the fair market value that is determined by local assessors to be the total taxable value of land and additions on the property. | Land | Improvement |
|---|---|---|---|---|
| 2025 | $6,705 | $535,069 | $335,614 | $199,455 |
| 2024 | $6,705 | $524,579 | $329,034 | $195,545 |
| 2023 | $6,548 | $514,294 | $322,583 | $191,711 |
| 2022 | $6,412 | $504,210 | $316,258 | $187,952 |
| 2021 | $6,295 | $494,324 | $310,057 | $184,267 |
| 2019 | $6,099 | $479,663 | $300,861 | $178,802 |
| 2018 | $5,822 | $470,259 | $294,962 | $175,297 |
| 2016 | $5,400 | $452,000 | $283,509 | $168,491 |
| 2015 | $5,432 | $445,212 | $279,251 | $165,961 |
| 2014 | $5,440 | $436,492 | $273,781 | $162,711 |
Source: Public Records
Map
Nearby Homes
- 21223 Fountain Springs Rd
- 2710 Castle Rock Rd
- 2463 Harmony Hill Dr
- 21128 Trigger Ln
- 2831 Steeplechase Ln
- 2611 Steeplechase Ln
- 2621 Steeplechase Ln
- 2968 Crooked Creek Dr
- 21062 Quail Run Dr
- 2887 Shadow Canyon Rd
- 2820 Shadow Canyon Rd
- 2990 Malaga Cir Unit C
- 2905 Yucatan Place Unit A
- 2562 Steeplechase Ln
- 2945 Steeplechase Ln
- 2118 Tierra Loma Dr
- 3005 La Paz Ln Unit C
- 3145 Steeplechase Ln
- 2677 Wagon Train Ln
- 20834 E Boulder Ln
- 2616 Sunbright Dr
- 21320 Hidden Pines Dr
- 2624 Sunbright Dr
- 21311 Hidden Pines Dr
- 21330 Hidden Pines Dr
- 2609 Sunbright Dr
- 21319 Hidden Pines Dr
- 21307 Hidden Pines Dr
- 2617 Sunbright Dr
- 21325 Hidden Pines Dr
- 2603 Sunbright Dr
- 21303 Hidden Pines Dr
- 2623 Sunbright Dr
- 2630 Sunbright Dr
- 21338 Hidden Pines Dr
- 21305 Hipass Dr
- 21333 Hidden Pines Dr
- 21300 Hipass Dr
- 2631 Sunbright Dr
- 21242 Fountain Springs Rd