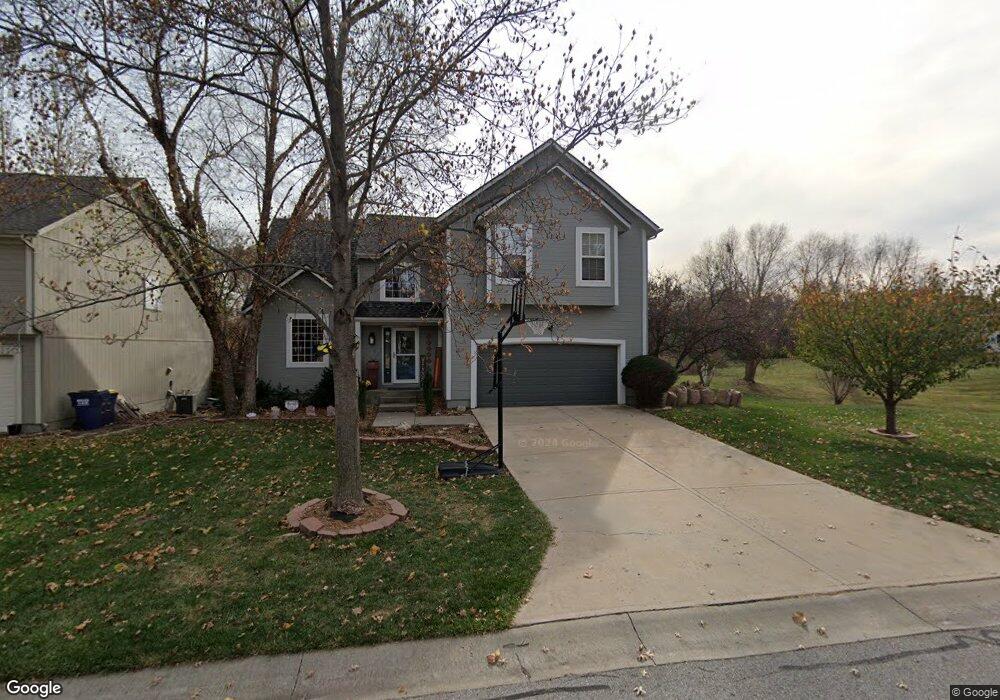
21315 W 50th Terrace Shawnee, KS 66218
Estimated Value: $441,330 - $468,000
4
Beds
4
Baths
2,124
Sq Ft
$216/Sq Ft
Est. Value
About This Home
This home is located at 21315 W 50th Terrace, Shawnee, KS 66218 and is currently estimated at $458,583, approximately $215 per square foot. 21315 W 50th Terrace is a home located in Johnson County with nearby schools including Riverview Elementary School, Mill Creek Middle School, and Mill Valley High School.
Ownership History
Date
Name
Owned For
Owner Type
Purchase Details
Closed on
Sep 16, 2015
Sold by
Friedman Nicholas J and Friedman Megan K
Bought by
The Nicolas J Friedman And Megan K Fried and Friedman Megan K
Current Estimated Value
Purchase Details
Closed on
Jun 21, 2009
Sold by
Mcallister Joel R and Mcallister Jacqueline C
Bought by
Friedman Nicholas J and Friedman Megan K
Home Financials for this Owner
Home Financials are based on the most recent Mortgage that was taken out on this home.
Original Mortgage
$201,600
Outstanding Balance
$127,785
Interest Rate
4.83%
Mortgage Type
Purchase Money Mortgage
Estimated Equity
$330,798
Purchase Details
Closed on
Jan 18, 2002
Sold by
Lagerblade Ross J and Lagerblade Tracy A
Bought by
Mcallister Joel R and Mcallister Jacqueline C
Home Financials for this Owner
Home Financials are based on the most recent Mortgage that was taken out on this home.
Original Mortgage
$179,550
Interest Rate
7.07%
Create a Home Valuation Report for This Property
The Home Valuation Report is an in-depth analysis detailing your home's value as well as a comparison with similar homes in the area
Home Values in the Area
Average Home Value in this Area
Purchase History
| Date | Buyer | Sale Price | Title Company |
|---|---|---|---|
| The Nicolas J Friedman And Megan K Fried | -- | None Available | |
| Friedman Nicholas J | -- | Superior Land Title Llc | |
| Mcallister Joel R | -- | Security Land Title Company |
Source: Public Records
Mortgage History
| Date | Status | Borrower | Loan Amount |
|---|---|---|---|
| Open | Friedman Nicholas J | $201,600 | |
| Previous Owner | Mcallister Joel R | $179,550 |
Source: Public Records
Tax History Compared to Growth
Tax History
| Year | Tax Paid | Tax Assessment Tax Assessment Total Assessment is a certain percentage of the fair market value that is determined by local assessors to be the total taxable value of land and additions on the property. | Land | Improvement |
|---|---|---|---|---|
| 2024 | $5,340 | $45,966 | $9,251 | $36,715 |
| 2023 | $4,959 | $42,193 | $8,405 | $33,788 |
| 2022 | $4,684 | $39,042 | $7,639 | $31,403 |
| 2021 | $4,406 | $35,271 | $7,281 | $27,990 |
| 2020 | $4,020 | $31,878 | $6,067 | $25,811 |
| 2019 | $3,784 | $29,555 | $5,250 | $24,305 |
| 2018 | $3,817 | $29,555 | $5,250 | $24,305 |
| 2017 | $3,934 | $29,728 | $4,566 | $25,162 |
| 2016 | $3,750 | $27,980 | $4,154 | $23,826 |
| 2015 | $3,686 | $27,060 | $4,154 | $22,906 |
| 2013 | -- | $24,495 | $4,154 | $20,341 |
Source: Public Records
Map
Nearby Homes
- 21408 W 50th St
- 21222 W 48th St
- 21525 W 51st St
- 4754 Lakecrest Dr
- 5015 Millbrook St
- 4713 Lone Elm
- 5311 Brownridge Dr
- 21804 W 52nd Terrace
- 5307 Noble St
- 4531 Woodstock St
- 5116 Payne St
- 22014 W 51st St
- 5405 Lakecrest Dr
- 20823 W 45th Terrace
- 21624 W 53rd Terrace
- 5206 Round Prairie St
- 22014 W 47th Terrace
- 22115 W 51st Terrace
- 21217 W 55th Terrace
- 5402 Roundtree St
- 21309 W 50th Terrace
- 21303 W 50th Terrace
- 21316 W 50th Terrace
- 21310 W 50th Terrace
- 21217 W 50th Terrace
- 21322 W 50th Terrace
- 21328 W 50th Terrace
- 21211 W 50th Terrace
- 5017 Marion St
- 21403 W 50th Terrace
- 5008 Marion St
- 6829 Marion
- 5009 Brownridge Dr
- 5053 Brownridge Dr
- 21409 W 50th Terrace
- 21218 W 51st St
- 21205 W 50th Terrace
- 21224 W 51st St
- 5018 Lakecrest Dr
- 21212 W 51st St