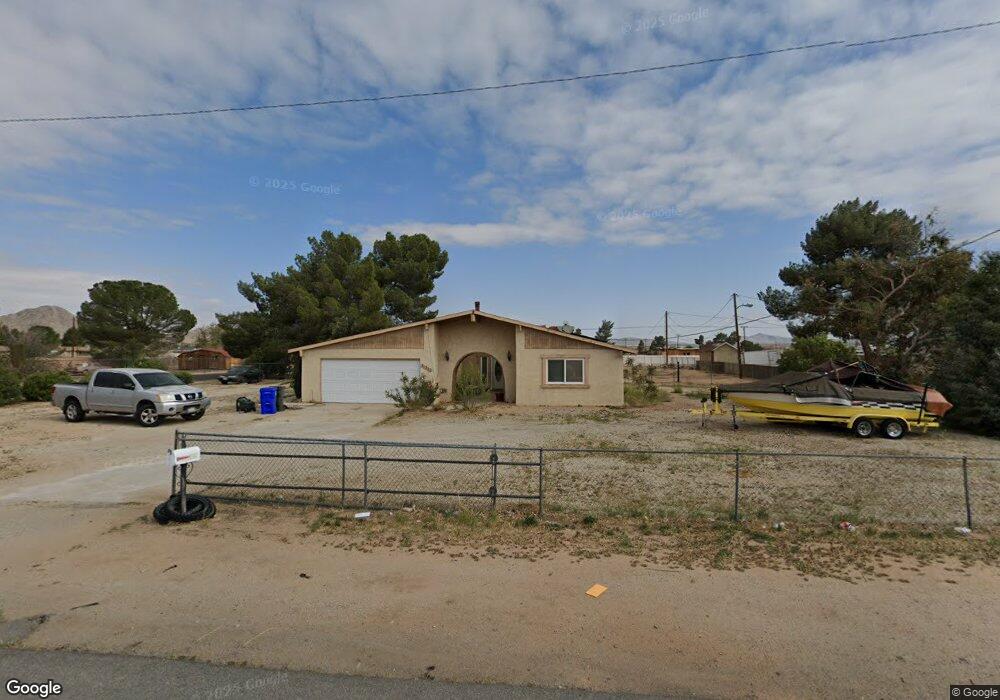
21320 Thunderbird Rd Apple Valley, CA 92307
High Desert NeighborhoodEstimated Value: $408,215 - $462,000
3
Beds
2
Baths
1,980
Sq Ft
$221/Sq Ft
Est. Value
About This Home
This home is located at 21320 Thunderbird Rd, Apple Valley, CA 92307 and is currently estimated at $437,054, approximately $220 per square foot. 21320 Thunderbird Rd is a home located in San Bernardino County with nearby schools including Sycamore Rocks Elementary School, Granite Hills High School, and Apple Valley Christian.
Ownership History
Date
Name
Owned For
Owner Type
Purchase Details
Closed on
Nov 9, 2009
Sold by
May Ronald John
Bought by
Lassman Alexander C
Current Estimated Value
Home Financials for this Owner
Home Financials are based on the most recent Mortgage that was taken out on this home.
Original Mortgage
$122,735
Outstanding Balance
$79,442
Interest Rate
4.83%
Mortgage Type
FHA
Estimated Equity
$357,612
Purchase Details
Closed on
Sep 28, 2004
Sold by
May Ronald John
Bought by
May Ronald John and May Helen Jean
Purchase Details
Closed on
Dec 18, 2000
Sold by
Brungardt Therese
Bought by
May Ronald J and May Helen
Home Financials for this Owner
Home Financials are based on the most recent Mortgage that was taken out on this home.
Original Mortgage
$107,737
Interest Rate
7.71%
Mortgage Type
FHA
Purchase Details
Closed on
Feb 19, 2000
Sold by
Creamer Hubert E
Bought by
The Creamer Family Trust
Purchase Details
Closed on
Apr 16, 1998
Sold by
Underwood Jennifer M
Bought by
Creamer Hubert E
Create a Home Valuation Report for This Property
The Home Valuation Report is an in-depth analysis detailing your home's value as well as a comparison with similar homes in the area
Home Values in the Area
Average Home Value in this Area
Purchase History
| Date | Buyer | Sale Price | Title Company |
|---|---|---|---|
| Lassman Alexander C | $131,000 | First American Title Company | |
| May Ronald John | -- | -- | |
| May Ronald John | -- | -- | |
| May Ronald J | $109,000 | Stewart Title | |
| The Creamer Family Trust | -- | -- | |
| Creamer Hubert E | $68,000 | First American Title Ins Co |
Source: Public Records
Mortgage History
| Date | Status | Borrower | Loan Amount |
|---|---|---|---|
| Open | Lassman Alexander C | $122,735 | |
| Previous Owner | May Ronald J | $107,737 |
Source: Public Records
Tax History
| Year | Tax Paid | Tax Assessment Tax Assessment Total Assessment is a certain percentage of the fair market value that is determined by local assessors to be the total taxable value of land and additions on the property. | Land | Improvement |
|---|---|---|---|---|
| 2025 | $2,068 | $169,100 | $50,731 | $118,369 |
| 2024 | $2,011 | $165,784 | $49,736 | $116,048 |
| 2023 | $1,992 | $162,534 | $48,761 | $113,773 |
| 2022 | $1,961 | $159,347 | $47,805 | $111,542 |
| 2021 | $1,917 | $156,223 | $46,868 | $109,355 |
| 2020 | $1,893 | $154,621 | $46,387 | $108,234 |
| 2019 | $1,858 | $151,589 | $45,477 | $106,112 |
| 2018 | $1,813 | $148,616 | $44,585 | $104,031 |
| 2017 | $1,788 | $145,702 | $43,711 | $101,991 |
| 2016 | $1,699 | $142,845 | $42,854 | $99,991 |
| 2015 | $1,674 | $140,699 | $42,210 | $98,489 |
| 2014 | $1,572 | $132,300 | $26,500 | $105,800 |
Source: Public Records
Map
Nearby Homes
- 14978 Blackfoot Rd
- 15135 Cheyenne Rd
- 15111 Cheyenne Rd
- 15395 Apache Rd
- 3 Navajo Rd
- 15620 Ramona Rd
- 0 Navajo Rd Unit HD22095581
- 0 Navajo Rd Unit HD26047594
- 0 Navajo Rd Unit PW25235911
- 0 Navajo Rd Unit PW25044353
- 0 Navajo Rd Unit HD25222307
- 0 Navajo Rd Unit HD25201383
- 0 Navajo Rd Unit CV25179571
- 14915 Ramona Rd
- 15100 Blackfoot Rd
- 20916 Thunderbird Rd
- 7 Navajo Rd
- 15605 Dale Evans Pkwy
- 20891 Thunderbird Rd
- 21291 Ramona Ave
- 21342 Thunderbird Rd
- 21292 Thunderbird Rd
- 15355 Cheyenne Rd
- 15352 Cheyenne Rd
- 21370 Thunderbird Rd
- 21321 Thunderbird Rd
- 21345 Thunderbird Rd
- 15375 Cheyenne Rd
- 21268 Thunderbird Rd
- 21291 Thunderbird Rd
- 21369 Thunderbird Rd
- 15380 Cheyenne Rd
- 21380 Thunderbird Rd
- 21271 Thunderbird Rd
- 15395 Cheyenne Rd
- 21248 Thunderbird Rd
- 15352 Dakota Rd
- 15241 Cheyenne Rd
- 21391 Thunderbird Rd
- 15394 Cheyenne Rd
Your Personal Tour Guide
Ask me questions while you tour the home.