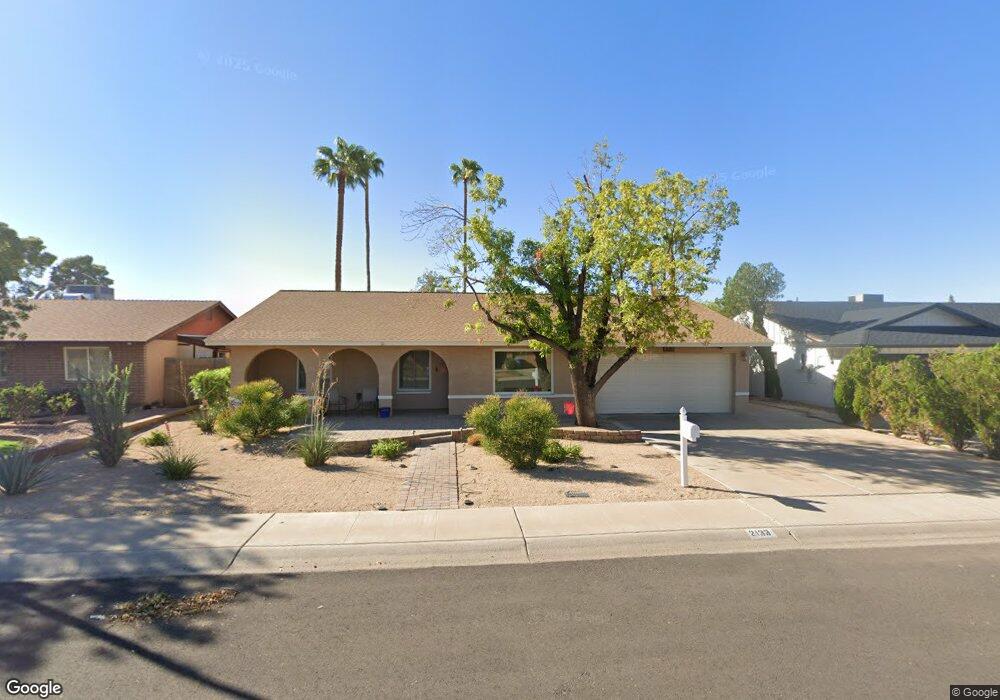
2133 E Apollo Ave Tempe, AZ 85283
The Lakes NeighborhoodEstimated Value: $435,310 - $512,000
Studio
2
Baths
1,592
Sq Ft
$305/Sq Ft
Est. Value
About This Home
This home is located at 2133 E Apollo Ave, Tempe, AZ 85283 and is currently estimated at $486,328, approximately $305 per square foot. 2133 E Apollo Ave is a home located in Maricopa County with nearby schools including Fuller Elementary School, Fees College Preparatory Middle School, and Marcos De Niza High School.
Ownership History
Date
Name
Owned For
Owner Type
Purchase Details
Closed on
Jul 24, 2020
Sold by
Dyer Laurence D and Dyer Angela K
Bought by
Dyer Laurence D and Dyer Angela K
Current Estimated Value
Purchase Details
Closed on
Aug 16, 2005
Sold by
Royse Richard D and Royse Jo Ann
Bought by
Dyer Laurence D and Dyer Angela K
Home Financials for this Owner
Home Financials are based on the most recent Mortgage that was taken out on this home.
Original Mortgage
$215,720
Outstanding Balance
$112,956
Interest Rate
5.61%
Mortgage Type
New Conventional
Estimated Equity
$373,372
Purchase Details
Closed on
Apr 14, 1994
Sold by
Sornsin Thomas C and Sornsin Jodi M
Bought by
Royse Richard D and Royse Joann
Home Financials for this Owner
Home Financials are based on the most recent Mortgage that was taken out on this home.
Original Mortgage
$75,200
Interest Rate
7.59%
Mortgage Type
New Conventional
Create a Home Valuation Report for This Property
The Home Valuation Report is an in-depth analysis detailing your home's value as well as a comparison with similar homes in the area
Home Values in the Area
Average Home Value in this Area
Purchase History
| Date | Buyer | Sale Price | Title Company |
|---|---|---|---|
| Dyer Laurence D | -- | None Available | |
| Dyer Laurence D | $269,651 | Stewart Title & Trust Of Pho | |
| Royse Richard D | $94,000 | Security Title Agency |
Source: Public Records
Mortgage History
| Date | Status | Borrower | Loan Amount |
|---|---|---|---|
| Open | Dyer Laurence D | $215,720 | |
| Previous Owner | Royse Richard D | $75,200 |
Source: Public Records
Tax History
| Year | Tax Paid | Tax Assessment Tax Assessment Total Assessment is a certain percentage of the fair market value that is determined by local assessors to be the total taxable value of land and additions on the property. | Land | Improvement |
|---|---|---|---|---|
| 2025 | $2,568 | $24,629 | -- | -- |
| 2024 | $2,356 | $23,456 | -- | -- |
| 2023 | $2,356 | $38,500 | $7,700 | $30,800 |
| 2022 | $2,250 | $28,000 | $5,600 | $22,400 |
| 2021 | $2,294 | $26,000 | $5,200 | $20,800 |
| 2020 | $2,218 | $24,300 | $4,860 | $19,440 |
| 2019 | $2,176 | $22,600 | $4,520 | $18,080 |
| 2018 | $2,117 | $20,870 | $4,170 | $16,700 |
| 2017 | $2,051 | $19,110 | $3,820 | $15,290 |
| 2016 | $2,041 | $18,760 | $3,750 | $15,010 |
| 2015 | $1,974 | $16,860 | $3,370 | $13,490 |
Source: Public Records
Map
Nearby Homes
- 2137 E Apollo Ave
- 2137 E Cornell Dr
- 5817 S Siesta Ln
- 2041 E Radcliffe Dr
- 2717 W Medina Ave
- 5352 S Country Club Way
- 6320 S Shannon Dr Unit 9
- 2132 E Tulane Dr
- 2401 S Saratoga
- 2030 E Colgate Dr
- 2628 W Mendoza Cir
- 1919 E Auburn Dr
- 2713 W Nido Ave
- 2116 E Colgate Dr
- 2021 E Pegasus Dr
- 2543 W Madero Ave
- 1915 E Gemini Dr Unit 6
- 2260 S Estrella
- 6411 S River Dr Unit 6
- 1867 E Oxford Dr
- 2129 E Apollo Ave
- 2130 E La Donna Dr Unit 8
- 2132 E La Donna Dr
- 2141 E Apollo Ave
- 2125 E Apollo Ave
- 2132 E Apollo Ave
- 2136 E Apollo Ave
- 2128 E Apollo Ave
- 2134 E La Donna Dr
- 2122 E La Donna Dr
- 2121 E Apollo Ave
- 2145 E Apollo Ave
- 2124 E Apollo Ave
- 2120 E La Donna Dr
- 2124 E La Donna Dr
- 2136 E La Donna Dr Unit 8
- 2144 E Apollo Ave
- 2144 E Apollo Ave
- 2120 E Apollo Ave
- 2149 E Apollo Ave
Your Personal Tour Guide
Ask me questions while you tour the home.