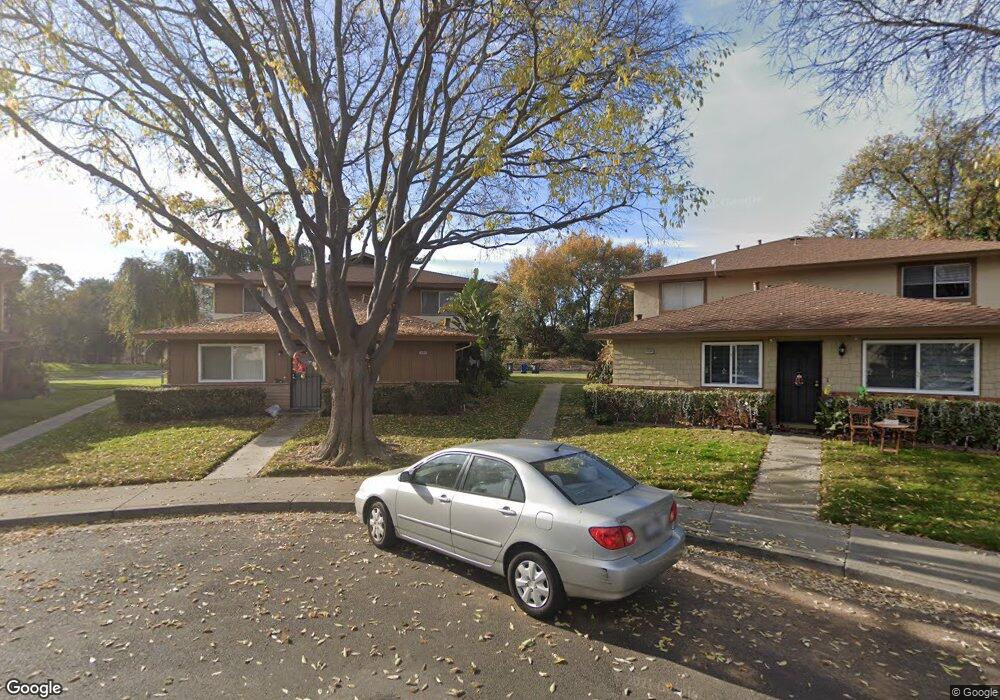
2133 Eric Ct Unit 2 Union City, CA 94587
Estimated Value: $490,000 - $535,000
2
Beds
1
Bath
903
Sq Ft
$565/Sq Ft
Est. Value
About This Home
This home is located at 2133 Eric Ct Unit 2, Union City, CA 94587 and is currently estimated at $509,886, approximately $564 per square foot. 2133 Eric Ct Unit 2 is a home located in Alameda County with nearby schools including Tom Kitayama Elementary School, Cesar Chavez Middle School, and James Logan High School.
Ownership History
Date
Name
Owned For
Owner Type
Purchase Details
Closed on
Apr 25, 2008
Sold by
Flores Artemio and Flores Kym M
Bought by
Flores Artemio and Flores Kym M
Current Estimated Value
Home Financials for this Owner
Home Financials are based on the most recent Mortgage that was taken out on this home.
Original Mortgage
$214,000
Outstanding Balance
$135,454
Interest Rate
5.87%
Mortgage Type
Stand Alone Refi Refinance Of Original Loan
Estimated Equity
$374,432
Purchase Details
Closed on
Feb 24, 2003
Sold by
Castro Donald R
Bought by
Flores Artemio and Limasa Kym M
Home Financials for this Owner
Home Financials are based on the most recent Mortgage that was taken out on this home.
Original Mortgage
$182,580
Interest Rate
5.93%
Mortgage Type
Purchase Money Mortgage
Purchase Details
Closed on
Jun 1, 1998
Sold by
Castro Donald R and Castro Lisa
Bought by
Castro Donald R
Create a Home Valuation Report for This Property
The Home Valuation Report is an in-depth analysis detailing your home's value as well as a comparison with similar homes in the area
Home Values in the Area
Average Home Value in this Area
Purchase History
| Date | Buyer | Sale Price | Title Company |
|---|---|---|---|
| Flores Artemio | -- | First American Title | |
| Flores Artemio | $214,000 | -- | |
| Castro Donald R | -- | -- |
Source: Public Records
Mortgage History
| Date | Status | Borrower | Loan Amount |
|---|---|---|---|
| Open | Flores Artemio | $214,000 | |
| Closed | Flores Artemio | $182,580 | |
| Closed | Flores Artemio | $25,000 |
Source: Public Records
Tax History
| Year | Tax Paid | Tax Assessment Tax Assessment Total Assessment is a certain percentage of the fair market value that is determined by local assessors to be the total taxable value of land and additions on the property. | Land | Improvement |
|---|---|---|---|---|
| 2025 | $5,094 | $309,914 | $92,974 | $216,940 |
| 2024 | $5,094 | $303,838 | $91,151 | $212,687 |
| 2023 | $4,897 | $297,883 | $89,365 | $208,518 |
| 2022 | $4,794 | $292,043 | $87,613 | $204,430 |
| 2021 | $4,691 | $286,318 | $85,895 | $200,423 |
| 2020 | $4,614 | $283,384 | $85,015 | $198,369 |
| 2019 | $4,651 | $277,828 | $83,348 | $194,480 |
| 2018 | $4,541 | $272,383 | $81,715 | $190,668 |
| 2017 | $4,432 | $267,043 | $80,113 | $186,930 |
| 2016 | $4,272 | $261,808 | $78,542 | $183,266 |
| 2015 | $4,190 | $257,877 | $77,363 | $180,514 |
| 2014 | $4,041 | $252,827 | $75,848 | $176,979 |
Source: Public Records
Map
Nearby Homes
- 32608 Brenda Way Unit 4
- 32625 Brenda Way Unit 1
- 32224 Sloccum Ct
- 32656 Brenda Way Unit 2
- 32368 Derby St
- 2676 Great Arbor Way Unit 45
- 2432 Balmoral St
- 3131 Grand Lake Dr
- 389 Tropicana Way
- 437 Samoa Cir Unit 437
- 3020 San Andreas Dr
- 418 Fiji Cir Unit 418
- 2444 Douglas St
- 2449 Almaden Blvd
- 179 Kona Cir
- 2447 Douglas St
- 32451 Lake Ree St
- 33010 Lake Mead Dr
- 17 Palm Dr
- 259 Molokai Cir Unit 259
- 2133 Eric Ct Unit 3
- 2133 Eric Ct Unit 1
- 2139 Eric Ct Unit 4
- 2139 Eric Ct Unit 2
- 2139 Eric Ct
- 2139 Eric Ct Unit 34
- 2139 Eric Ct Unit 3
- 2139 Eric Ct Unit 1
- 2124 Eric Ct Unit 3
- 2124 Eric Ct Unit 1
- 2124 Eric Ct Unit 4
- 2116 Eric Ct Unit 2
- 2116 Eric Ct Unit 1
- 2116 Eric Ct Unit 4
- 2116 Eric Ct Unit 3
- 2147 Eric Ct Unit 4
- 2147 Eric Ct
- 2147 Eric Ct Unit 3
- 2454 Brenda Way Unit 4
- 2454 Brenda Way
Your Personal Tour Guide
Ask me questions while you tour the home.