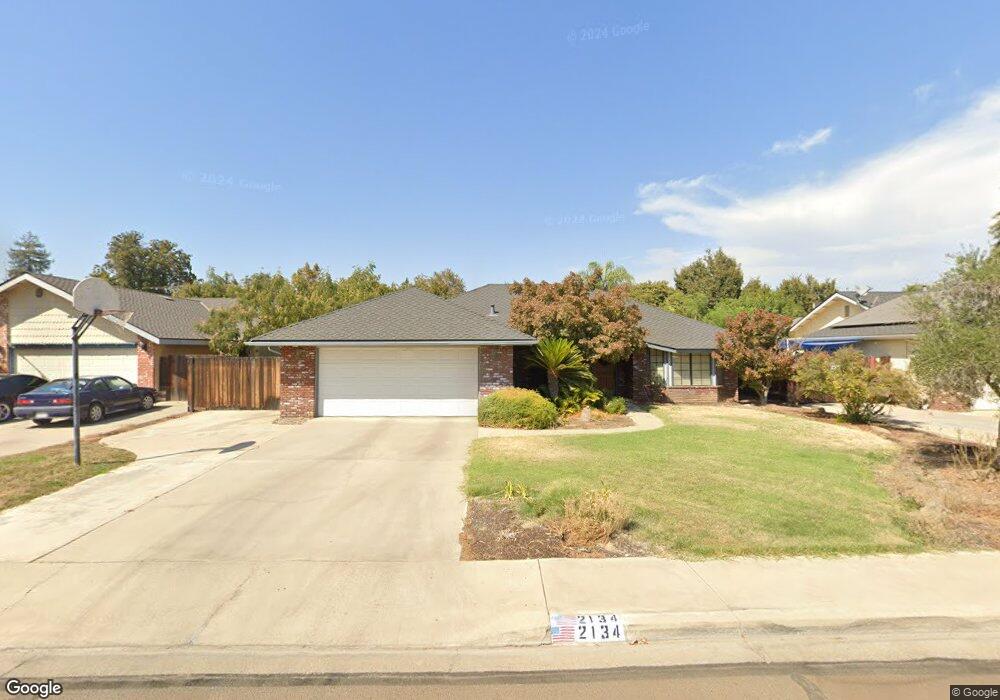
2134 E Iris Ave Visalia, CA 93292
Southeast Visalia NeighborhoodEstimated Value: $309,000 - $406,205
3
Beds
3
Baths
1,706
Sq Ft
$198/Sq Ft
Est. Value
About This Home
This home is located at 2134 E Iris Ave, Visalia, CA 93292 and is currently estimated at $337,551, approximately $197 per square foot. 2134 E Iris Ave is a home located in Tulare County with nearby schools including Pinkham Elementary School, Valley Oak Middle School, and Golden West High School.
Ownership History
Date
Name
Owned For
Owner Type
Purchase Details
Closed on
Oct 27, 2025
Sold by
Tony E Saucedo Family Trust and Saucedo Tony E
Bought by
Hs Property Holdings Lp
Current Estimated Value
Home Financials for this Owner
Home Financials are based on the most recent Mortgage that was taken out on this home.
Original Mortgage
$315,000
Outstanding Balance
$315,000
Interest Rate
6.26%
Mortgage Type
New Conventional
Estimated Equity
$22,551
Purchase Details
Closed on
Oct 24, 2006
Sold by
Saucedo Tony E
Bought by
Saucedo Tony E and The Tony E Saucedo Family Trust
Home Financials for this Owner
Home Financials are based on the most recent Mortgage that was taken out on this home.
Original Mortgage
$222,600
Interest Rate
6.36%
Mortgage Type
New Conventional
Purchase Details
Closed on
Sep 14, 2005
Sold by
Saucedo Tony E
Bought by
Saucedo Tony E and Tony E Saucedo Family Trust
Home Financials for this Owner
Home Financials are based on the most recent Mortgage that was taken out on this home.
Original Mortgage
$139,500
Interest Rate
5.62%
Mortgage Type
Fannie Mae Freddie Mac
Purchase Details
Closed on
Apr 1, 1998
Sold by
Saucedo Tony E
Bought by
Saucedo Tony E and The Tony E Saucedo Family Trust
Create a Home Valuation Report for This Property
The Home Valuation Report is an in-depth analysis detailing your home's value as well as a comparison with similar homes in the area
Home Values in the Area
Average Home Value in this Area
Purchase History
| Date | Buyer | Sale Price | Title Company |
|---|---|---|---|
| Hs Property Holdings Lp | $310,000 | None Listed On Document | |
| Saucedo Tony E | -- | Chicago Title Co | |
| Saucedo Tony E | -- | Chicago Title Co | |
| Saucedo Tony E | -- | -- | |
| Saucedo Tony E | -- | -- | |
| Saucedo Tony E | -- | -- |
Source: Public Records
Mortgage History
| Date | Status | Borrower | Loan Amount |
|---|---|---|---|
| Open | Hs Property Holdings Lp | $315,000 | |
| Previous Owner | Saucedo Tony E | $222,600 | |
| Previous Owner | Saucedo Tony E | $139,500 |
Source: Public Records
Tax History
| Year | Tax Paid | Tax Assessment Tax Assessment Total Assessment is a certain percentage of the fair market value that is determined by local assessors to be the total taxable value of land and additions on the property. | Land | Improvement |
|---|---|---|---|---|
| 2025 | $2,183 | $208,259 | $45,699 | $162,560 |
| 2024 | $2,183 | $204,176 | $44,803 | $159,373 |
| 2023 | $2,123 | $200,174 | $43,925 | $156,249 |
| 2022 | $2,030 | $196,250 | $43,064 | $153,186 |
| 2021 | $2,031 | $192,402 | $42,220 | $150,182 |
| 2020 | $2,013 | $190,429 | $41,787 | $148,642 |
| 2019 | $1,957 | $186,695 | $40,968 | $145,727 |
| 2018 | $1,907 | $183,035 | $40,165 | $142,870 |
| 2017 | $1,887 | $179,446 | $39,377 | $140,069 |
| 2016 | $1,851 | $175,928 | $38,605 | $137,323 |
| 2015 | $1,797 | $173,285 | $38,025 | $135,260 |
| 2014 | $1,797 | $169,890 | $37,280 | $132,610 |
Source: Public Records
Map
Nearby Homes
- 1047 S Pinkham St
- 2242 E Howard Ave
- 2417 E Howard Ave
- 3142 S Kennedy St
- 3132 S Kennedy St
- 2415 E Feemster Ave
- 1900 E College Ave
- 2418 E Princeton Ave
- 1848 E Vassar Dr
- 2635 E Paradise Ave
- 1836 E Vassar Dr
- 1818 S Cain Ct
- 1818 S Cain St
- 3220 E Tulare Ave
- 3232 E Tulare Ave
- 2928 E Tulare Ave
- 2423 E Vassar Dr
- 1010 S Lovers Ln
- 1219 E Feemster Ave
- 1515 E Castlecrest Ave
- 2122 E Iris Ave
- 2202 E Iris Ave
- 2112 E Iris Ave
- 2135 E Iris Ave
- 2145 E Iris Ave
- 2216 E Iris Ave
- 2121 E Iris Ave
- 2203 E Iris Ave
- 2111 E Iris Ave
- 2219 E Iris Ave
- 1215 S Irma Ct
- 1227 S Irma Ct
- 2138 E Howard Ave
- 2126 E Howard Ave
- 2202 E Howard Ave
- 1308 S Pinkham St
- 1127 S Pinkham St
- 1125 S Pinkham St
- 2231 E Iris Ave
- 1237 S Pinkham St
Your Personal Tour Guide
Ask me questions while you tour the home.