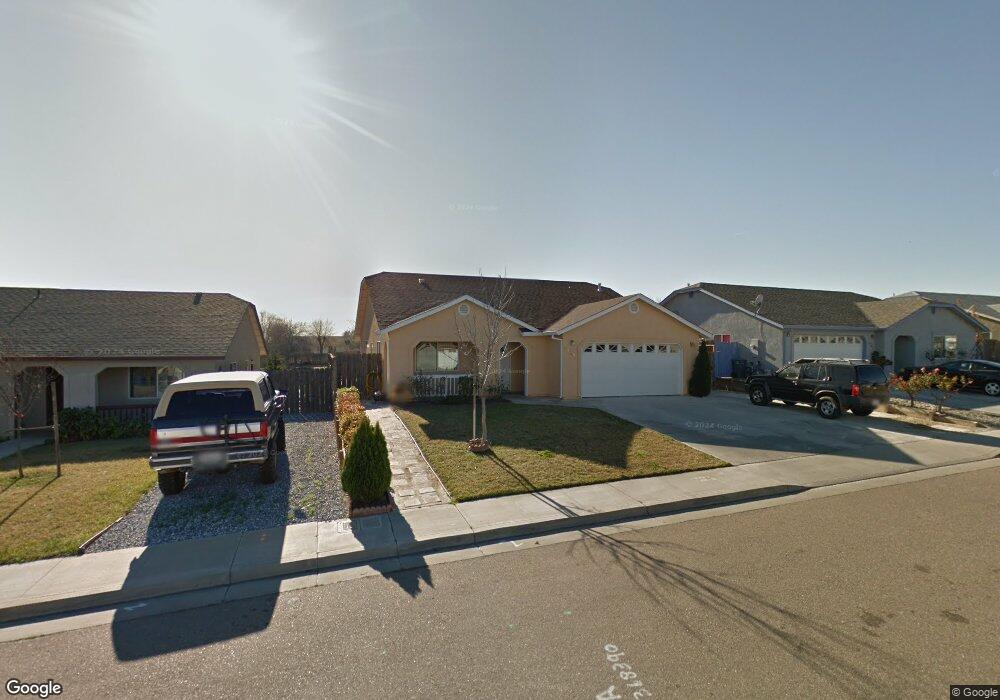
2135 Gentry Way Red Bluff, CA 96080
Estimated Value: $274,000 - $339,000
5
Beds
2
Baths
1,460
Sq Ft
$211/Sq Ft
Est. Value
About This Home
This home is located at 2135 Gentry Way, Red Bluff, CA 96080 and is currently estimated at $308,768, approximately $211 per square foot. 2135 Gentry Way is a home located in Tehama County with nearby schools including Jackson Heights Elementary School, Vista Preparatory Academy, and Red Bluff High School.
Ownership History
Date
Name
Owned For
Owner Type
Purchase Details
Closed on
Dec 1, 2010
Sold by
Mitchell Carl
Bought by
Mitchell Carl and Mitchell Roy A
Current Estimated Value
Purchase Details
Closed on
Sep 15, 2010
Sold by
Pinnacle Equity Group Lp
Bought by
Mitchell Carl
Home Financials for this Owner
Home Financials are based on the most recent Mortgage that was taken out on this home.
Original Mortgage
$108,750
Outstanding Balance
$71,592
Interest Rate
4.38%
Mortgage Type
New Conventional
Estimated Equity
$237,176
Purchase Details
Closed on
Jul 7, 2010
Sold by
Mitchell Geraldine
Bought by
Mitchell Roy A
Purchase Details
Closed on
Feb 23, 2010
Sold by
Chavarria Mario
Bought by
Pinnacle Equity Group Lp
Home Financials for this Owner
Home Financials are based on the most recent Mortgage that was taken out on this home.
Original Mortgage
$103,350
Interest Rate
4.97%
Mortgage Type
Purchase Money Mortgage
Purchase Details
Closed on
Jun 6, 2004
Sold by
Community Housing Improvement Program In
Bought by
Chavarria Mario
Home Financials for this Owner
Home Financials are based on the most recent Mortgage that was taken out on this home.
Original Mortgage
$119,000
Interest Rate
5.99%
Mortgage Type
Construction
Create a Home Valuation Report for This Property
The Home Valuation Report is an in-depth analysis detailing your home's value as well as a comparison with similar homes in the area
Purchase History
| Date | Buyer | Sale Price | Title Company |
|---|---|---|---|
| Mitchell Carl | -- | None Available | |
| Mitchell Carl | $145,000 | Placer Title Company | |
| Mitchell Roy A | -- | None Available | |
| Pinnacle Equity Group Lp | $108,750 | None Available | |
| Chavarria Mario | $40,000 | Northern California Title Co |
Source: Public Records
Mortgage History
| Date | Status | Borrower | Loan Amount |
|---|---|---|---|
| Open | Mitchell Carl | $108,750 | |
| Previous Owner | Pinnacle Equity Group Lp | $103,350 | |
| Previous Owner | Chavarria Mario | $119,000 |
Source: Public Records
Tax History
| Year | Tax Paid | Tax Assessment Tax Assessment Total Assessment is a certain percentage of the fair market value that is determined by local assessors to be the total taxable value of land and additions on the property. | Land | Improvement |
|---|---|---|---|---|
| 2025 | $1,890 | $185,757 | $64,052 | $121,705 |
| 2023 | $1,858 | $178,546 | $61,566 | $116,980 |
| 2022 | $1,846 | $175,046 | $60,359 | $114,687 |
| 2021 | $1,771 | $171,615 | $59,176 | $112,439 |
| 2020 | $1,808 | $169,857 | $58,570 | $111,287 |
| 2019 | $1,819 | $166,527 | $57,422 | $109,105 |
| 2018 | $1,683 | $163,263 | $56,297 | $106,966 |
| 2017 | $1,698 | $160,063 | $55,194 | $104,869 |
| 2016 | $1,586 | $156,925 | $54,112 | $102,813 |
| 2015 | -- | $154,569 | $53,300 | $101,269 |
| 2014 | $1,539 | $151,542 | $52,256 | $99,286 |
Source: Public Records
Map
Nearby Homes
- 2132 Reta Way
- 1715 Walbridge St
- 1710 Luning St
- 1707 Luning St
- 0 Ludlow Ave Unit SN25045951
- 1835 Douglass St
- 1356 Park Ave
- 1359 2nd St
- 1549 Jackson St
- 0 Derby Unit 24724349
- 1426 Lincoln St
- 1313 Jackson St
- 605 Breckenridge St
- Lot D Aloe Place
- 685 Larie Ln
- 927 Cedar St
- 675 Larie Ln
- 1158 Madison St
- 245 Walton Ave
- 545 Cedar St
- 2145 Gentry Way
- 2115 Gentry Way
- 2155 Gentry Way
- 2140 Gentry Way
- 2150 Gentry Way
- 2130 Gentry Way
- 2105 Gentry Way
- 2165 Gentry Way
- 2120 Gentry Way
- 2160 Gentry Way
- 2160 Walbridge St
- 2190 Walbridge St
- 2175 Gentry Way
- 2110 Gentry Way
- 2035 Gentry Way
- 2140 Walbridge St
- 2127 Reta Way
- 2117 Reta Way
- 2137 Reta Way
- 2147 Reta Way
Your Personal Tour Guide
Ask me questions while you tour the home.