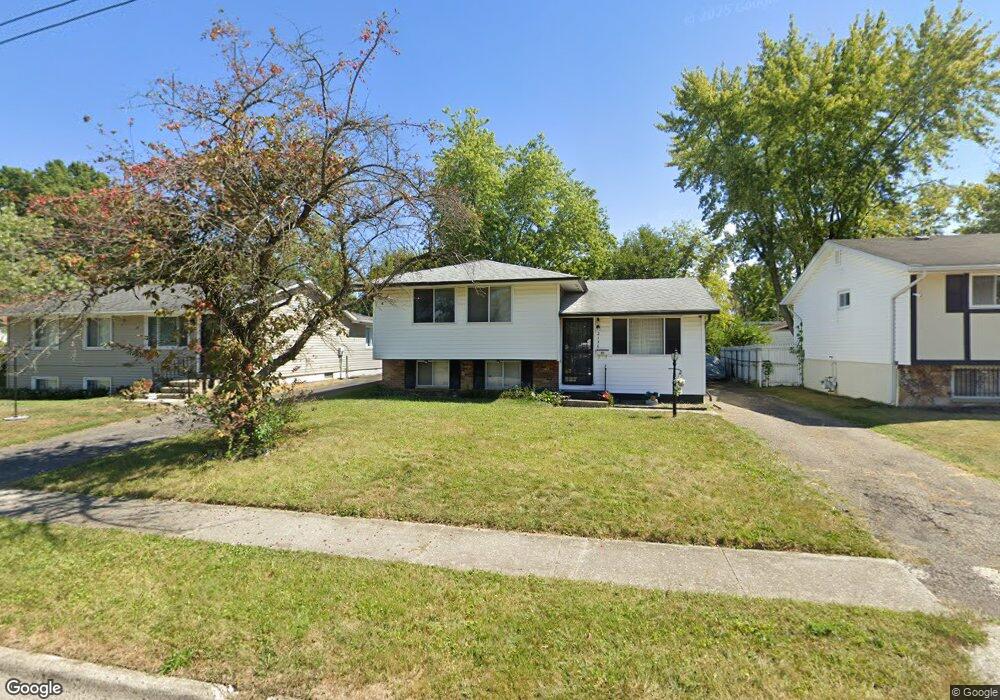
2136 Balford Square W Columbus, OH 43232
Glenbrook NeighborhoodEstimated Value: $200,983 - $235,000
3
Beds
2
Baths
924
Sq Ft
$236/Sq Ft
Est. Value
About This Home
This home is located at 2136 Balford Square W, Columbus, OH 43232 and is currently estimated at $218,496, approximately $236 per square foot. 2136 Balford Square W is a home located in Franklin County with nearby schools including Easthaven Elementary School, Yorktown Middle School, and Independence High School.
Ownership History
Date
Name
Owned For
Owner Type
Purchase Details
Closed on
May 26, 2021
Sold by
Estate Of Matthew A Eldridge
Bought by
Eldridge Angela J
Current Estimated Value
Purchase Details
Closed on
Jun 12, 2008
Sold by
Eldridge Matthew A and Eldridge Angela
Bought by
Eldridge Matthew A
Home Financials for this Owner
Home Financials are based on the most recent Mortgage that was taken out on this home.
Original Mortgage
$84,000
Interest Rate
6.09%
Mortgage Type
Seller Take Back
Purchase Details
Closed on
Sep 6, 1988
Bought by
Eldridge Matthew A
Create a Home Valuation Report for This Property
The Home Valuation Report is an in-depth analysis detailing your home's value as well as a comparison with similar homes in the area
Home Values in the Area
Average Home Value in this Area
Purchase History
| Date | Buyer | Sale Price | Title Company |
|---|---|---|---|
| Eldridge Angela J | -- | None Available | |
| Eldridge Matthew A | $86,000 | Connor Land Title | |
| Eldridge Matthew A | $62,000 | -- |
Source: Public Records
Mortgage History
| Date | Status | Borrower | Loan Amount |
|---|---|---|---|
| Previous Owner | Eldridge Matthew A | $84,000 |
Source: Public Records
Tax History Compared to Growth
Tax History
| Year | Tax Paid | Tax Assessment Tax Assessment Total Assessment is a certain percentage of the fair market value that is determined by local assessors to be the total taxable value of land and additions on the property. | Land | Improvement |
|---|---|---|---|---|
| 2024 | $2,086 | $56,280 | $16,450 | $39,830 |
| 2023 | $2,087 | $56,280 | $16,450 | $39,830 |
| 2022 | $937 | $26,820 | $6,340 | $20,480 |
| 2021 | $1,393 | $26,820 | $6,340 | $20,480 |
| 2020 | $940 | $26,820 | $6,340 | $20,480 |
| 2019 | $754 | $21,180 | $5,080 | $16,100 |
| 2018 | $816 | $21,180 | $5,080 | $16,100 |
| 2017 | $754 | $21,180 | $5,080 | $16,100 |
| 2016 | $969 | $23,380 | $4,410 | $18,970 |
| 2015 | $880 | $23,380 | $4,410 | $18,970 |
| 2014 | $882 | $23,380 | $4,410 | $18,970 |
| 2013 | $472 | $24,605 | $4,655 | $19,950 |
Source: Public Records
Map
Nearby Homes
- 2252 Meridian Ct
- 2275 Cardston Ct
- 3365 Bruceton Ave
- 3054 Wadsworth Ct
- 3038 Wadsworth Ct
- 3036 Wadsworth Ct
- 2425 Mason Village Ct Unit 2425
- 1836 Penfield Ct S
- 3325 E Deshler Ave
- 1664 Barnett Rd
- 3246 E Deshler Ave
- 0 Ravenswood Ct
- 2971 Queensrowe Dr
- 3830 Charbonnett Ct Unit 6-A
- 2472 Nassau Dr Unit 37D
- 1624 Miltwood Rd
- 1767 Alcoy Dr
- 2503 Burgandy Ln Unit 46A
- 1782 Newfield Rd
- 2509 Burgandy Ln Unit 46B
- 2128 Balford Square W
- 2148 Balford Square W
- 3333 Petzinger Rd
- 2143 Balford Square E
- 2137 Balford Square E
- 2149 Balford Square E
- 2154 Balford Square W
- 3345 Petzinger Rd
- 2155 Balford Square E
- 2135 Balford Square W
- 2129 Balford Square W
- 2141 Balford Square W
- 2121 Balford Square W
- 2160 Balford Square W
- 2163 Balford Square E
- 2149 Balford Square W
- 3309 Petzinger Rd
- 2155 Balford Square W
- 2169 Balford Square E
- 3338 Petzinger Rd