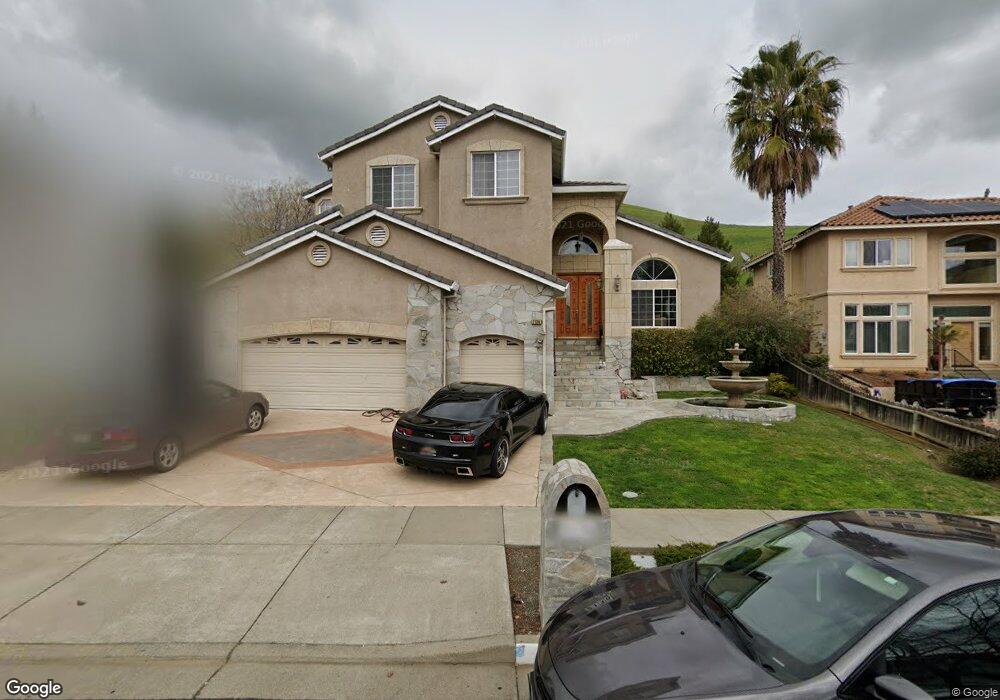
2136 Fieldcrest Ave Fairfield, CA 94534
Estimated Value: $779,320 - $846,000
6
Beds
3
Baths
3,189
Sq Ft
$254/Sq Ft
Est. Value
About This Home
This home is located at 2136 Fieldcrest Ave, Fairfield, CA 94534 and is currently estimated at $811,080, approximately $254 per square foot. 2136 Fieldcrest Ave is a home located in Solano County with nearby schools including Rolling Hills Elementary School, Fairfield High School, and Solano Christian Academy.
Ownership History
Date
Name
Owned For
Owner Type
Purchase Details
Closed on
Oct 11, 2018
Sold by
Pickar William B
Bought by
Pickar William and The Pickar Mai Living Trust
Current Estimated Value
Purchase Details
Closed on
Dec 16, 2013
Sold by
Mai Hoa T
Bought by
Pickar William B
Purchase Details
Closed on
Oct 7, 2013
Sold by
Fode Dale
Bought by
Fode Mei
Purchase Details
Closed on
Oct 2, 2013
Sold by
Mai Kim
Bought by
Fode Mei
Purchase Details
Closed on
Mar 1, 2007
Sold by
Delija Joe and Delija Michael
Bought by
Mai Kim
Purchase Details
Closed on
Sep 6, 2002
Sold by
Khan Shahrukh
Bought by
Delija Joe and Delija Michael
Purchase Details
Closed on
Nov 16, 1994
Sold by
Khan Shoaib Ali and Khatoon Zahida
Bought by
Khan Shahrukh
Create a Home Valuation Report for This Property
The Home Valuation Report is an in-depth analysis detailing your home's value as well as a comparison with similar homes in the area
Purchase History
| Date | Buyer | Sale Price | Title Company |
|---|---|---|---|
| Pickar William | -- | None Available | |
| Pickar William B | -- | Fidelity National Title Co | |
| Pickar William B | $385,000 | Fidelity National Title Co | |
| Fode Mei | -- | Fidelity National Title Co | |
| Fode Mei | $410,000 | Fidelity National Title Co | |
| Mai Kim | -- | None Available | |
| Delija Joe | $122,000 | Fidelity National Title Co | |
| Delija Michael | -- | Fidelity National Title Co | |
| Khan Shahrukh | -- | -- |
Source: Public Records
Tax History
| Year | Tax Paid | Tax Assessment Tax Assessment Total Assessment is a certain percentage of the fair market value that is determined by local assessors to be the total taxable value of land and additions on the property. | Land | Improvement |
|---|---|---|---|---|
| 2025 | $5,993 | $502,592 | $122,581 | $380,011 |
| 2024 | $5,993 | $492,738 | $120,178 | $372,560 |
| 2023 | $5,820 | $483,077 | $117,822 | $365,255 |
| 2022 | $5,828 | $473,606 | $115,512 | $358,094 |
| 2021 | $5,775 | $464,321 | $113,248 | $351,073 |
| 2020 | $5,970 | $459,561 | $112,087 | $347,474 |
| 2019 | $5,842 | $450,551 | $109,890 | $340,661 |
| 2018 | $5,999 | $441,718 | $107,736 | $333,982 |
| 2017 | $5,979 | $433,058 | $105,624 | $327,434 |
| 2016 | $5,945 | $424,567 | $103,553 | $321,014 |
| 2015 | $5,615 | $418,191 | $101,998 | $316,193 |
| 2014 | $5,573 | $410,000 | $100,000 | $310,000 |
Source: Public Records
Map
Nearby Homes
- 3442 Glen Ellen Dr
- 4017 The Masters Dr Unit 1
- 2932 Montclair Way
- 624 Emerald Hills Cir
- 497 Americano Way
- 3276 Arroyo Dr
- 2915 N Texas St Unit 129
- 2915 N Texas St Unit 157
- 3265 Arroyo Dr
- 2456 Shore Vista
- 120 Goya Dr
- 445 Lakehurst Ct
- 41 Goya Dr
- 2827 Sunburst Dr
- 15 Dali Ct
- 2825 Sundown Cir
- 2731 Orchid St
- 4595 Avondale Cir
- 702 Racoon Ct
- 2611 Lilac St
- 2140 Fieldcrest Ave
- 2132 Fieldcrest Ave
- 2144 Fieldcrest Ave
- 2133 Fieldcrest Ave
- 2129 Fieldcrest Ave
- 2137 Fieldcrest Ave
- 2124 Fieldcrest Ave
- 2148 Fieldcrest Ave
- 2125 Fieldcrest Ave
- 2141 Fieldcrest Ave
- 2120 Fieldcrest Ave
- 2152 Fieldcrest Ave
- 2145 Fieldcrest Ave
- 3537 Glenwood Dr
- 2140 Lakewood Dr
- 3533 Glenwood Dr
- 2116 Fieldcrest Ave
- 3529 Glenwood Dr
Your Personal Tour Guide
Ask me questions while you tour the home.