Estimated Value: $869,000 - $938,000
6
Beds
3
Baths
4,274
Sq Ft
$211/Sq Ft
Est. Value
About This Home
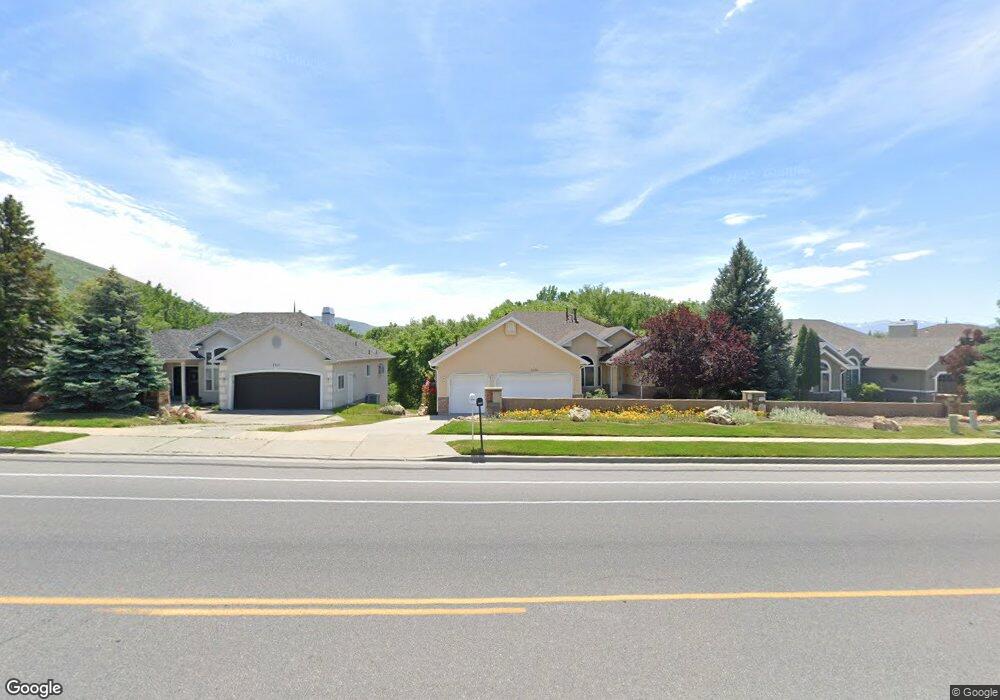
This home is located at 2136 Wasatch Blvd, Sandy, UT 84092 and is currently estimated at $901,919, approximately $211 per square foot. 2136 Wasatch Blvd is a home located in Salt Lake County with nearby schools including Bell Canyon Montessori School and Challenger School - Sandy.
Ownership History
Date
Name
Owned For
Owner Type
Purchase Details
Closed on
Jul 28, 2010
Sold by
Bumpus Irene B
Bought by
Bumpus Irene B and The Irene B Bumpus Revocable Living Trus
Current Estimated Value
Purchase Details
Closed on
Sep 19, 2006
Sold by
Orrell Donald B and Orrell Andrea L
Bought by
Bumpus Steve and Bumpus Irene
Purchase Details
Closed on
Sep 26, 2003
Sold by
Nail Lillian M and Nail Charles R
Bought by
Orrell Donald B and Orrell Andrea L
Purchase Details
Closed on
Feb 22, 1996
Sold by
Nail Lillian M
Bought by
Nail Lillian M and Nail Charles R
Home Financials for this Owner
Home Financials are based on the most recent Mortgage that was taken out on this home.
Original Mortgage
$197,875
Interest Rate
7.1%
Purchase Details
Closed on
Jul 19, 1995
Sold by
Tebbs Family Partnership
Bought by
Nail Lillian M
Home Financials for this Owner
Home Financials are based on the most recent Mortgage that was taken out on this home.
Original Mortgage
$191,200
Interest Rate
7.59%
Mortgage Type
Purchase Money Mortgage
Create a Home Valuation Report for This Property
The Home Valuation Report is an in-depth analysis detailing your home's value as well as a comparison with similar homes in the area
Home Values in the Area
Average Home Value in this Area
Purchase History
| Date | Buyer | Sale Price | Title Company |
|---|---|---|---|
| Bumpus Irene B | -- | None Available | |
| Bumpus Steve | -- | First American Title | |
| Orrell Donald B | -- | Superior Title | |
| Nail Lillian M | -- | -- | |
| Nail Lillian M | -- | -- |
Source: Public Records
Mortgage History
| Date | Status | Borrower | Loan Amount |
|---|---|---|---|
| Previous Owner | Nail Lillian M | $197,875 | |
| Previous Owner | Nail Lillian M | $191,200 |
Source: Public Records
Tax History
| Year | Tax Paid | Tax Assessment Tax Assessment Total Assessment is a certain percentage of the fair market value that is determined by local assessors to be the total taxable value of land and additions on the property. | Land | Improvement |
|---|---|---|---|---|
| 2025 | $3,975 | $796,200 | $261,700 | $534,500 |
| 2024 | $3,975 | $751,500 | $251,900 | $499,600 |
| 2023 | $3,868 | $730,800 | $242,300 | $488,500 |
| 2022 | $3,977 | $734,600 | $237,500 | $497,100 |
| 2021 | $3,444 | $541,700 | $184,700 | $357,000 |
| 2020 | $3,251 | $482,900 | $184,700 | $298,200 |
| 2019 | $3,126 | $453,200 | $174,300 | $278,900 |
| 2018 | $0 | $437,500 | $174,300 | $263,200 |
| 2017 | $3,008 | $436,500 | $174,300 | $262,200 |
| 2016 | $2,765 | $388,200 | $157,000 | $231,200 |
| 2015 | -- | $378,200 | $161,700 | $216,500 |
| 2014 | $2,899 | $370,700 | $161,700 | $209,000 |
Source: Public Records
Map
Nearby Homes
- 2122 Wasatch Blvd
- 2192 E High Mesa Dr
- 2232 E Lone Eagle Ln
- 11779 S Windcroft Ct
- 2234 E Willow Brook Way
- 11446 S 2320 E
- 11683 S 2460 E
- 11129 S 2125 E
- 11382 S Canyon Falls Ln
- 2373 E Bear Hills Cir
- 11318 Canyon Falls Ln
- 12056 S Cortina Crest Dr
- 2403 E Bear Hills Cir
- 7 Rollingwood Ln
- 35 E Lone Hollow Dr
- 18 Snow Forest Ln
- 1 Quietwood Ln
- 11551 S Woodhampton Dr
- 1653 Crescent View Dr
- 11341 S Silver Buckle Way
- 2142 Wasatch Blvd
- 2142 E Wasatch Blvd
- 2130 E Wasatch Blvd
- 2130 Wasatch Blvd
- 2148 Wasatch Blvd
- 2122 E Wasatch Blvd
- 2154 Wasatch Blvd
- 2154 Wasatch Blvd Unit 1
- 2154 Wasatch Blvd Unit 2
- 2114 Wasatch Blvd
- 11622 Terendale Ln
- 11622 S Terendale Ln
- 2114 E Wasatch Blvd
- 11638 S Terendale Ln
- 11638 Terendale Ln
- 11618 Terendale Ln
- 11618 S Terendale Ln
- 2104 E Wasatch Blvd
- 2160 E Wasatch Blvd
- 2104 Wasatch Blvd
Your Personal Tour Guide
Ask me questions while you tour the home.