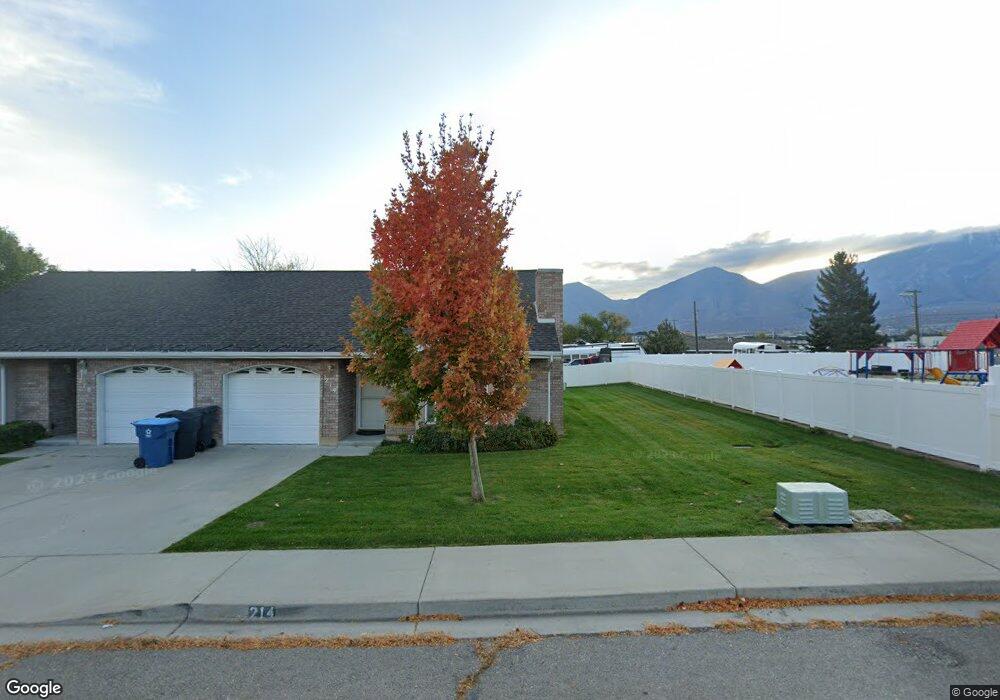
214 N 1140 E Payson, UT 84651
Estimated Value: $279,000 - $310,000
2
Beds
1
Bath
942
Sq Ft
$314/Sq Ft
Est. Value
About This Home
This home is located at 214 N 1140 E, Payson, UT 84651 and is currently estimated at $295,554, approximately $313 per square foot. 214 N 1140 E is a home located in Utah County with nearby schools including Barnett Elementary School, Salem Junior High School, and Valley View Middle School.
Ownership History
Date
Name
Owned For
Owner Type
Purchase Details
Closed on
Jun 24, 2020
Sold by
Mcgee Jesse and Mcgee Deanna
Bought by
Sjoberg Paul R and Sjoberg Lourdes A
Current Estimated Value
Home Financials for this Owner
Home Financials are based on the most recent Mortgage that was taken out on this home.
Original Mortgage
$205,000
Outstanding Balance
$181,375
Interest Rate
3.1%
Mortgage Type
New Conventional
Estimated Equity
$114,179
Purchase Details
Closed on
May 19, 2015
Sold by
Smith Cornell and Smith Iris
Bought by
Mcgee Jesse and Mcgee Deanna
Purchase Details
Closed on
Apr 14, 2011
Sold by
Brandon Deon L and Brandon Family Declaration Of
Bought by
Smith Cornell and Smith Iris
Purchase Details
Closed on
Jul 25, 2006
Sold by
Oberg Rebecca and Estate Of Manuel Russell Jr
Bought by
Brandon Deon L and Brandon Family Declaration Of
Purchase Details
Closed on
Aug 4, 2005
Sold by
Garner Ruth Park
Bought by
Russell Manuel and Russell Yvonnie
Create a Home Valuation Report for This Property
The Home Valuation Report is an in-depth analysis detailing your home's value as well as a comparison with similar homes in the area
Home Values in the Area
Average Home Value in this Area
Purchase History
| Date | Buyer | Sale Price | Title Company |
|---|---|---|---|
| Sjoberg Paul R | -- | Skyline Title Llc | |
| Mcgee Jesse | -- | North American Title | |
| Smith Cornell | -- | Gt Title Services Spanish | |
| Brandon Deon L | -- | Backman | |
| Brandon Deon L | -- | Backman | |
| Russell Manuel | -- | -- |
Source: Public Records
Mortgage History
| Date | Status | Borrower | Loan Amount |
|---|---|---|---|
| Open | Sjoberg Paul R | $205,000 |
Source: Public Records
Tax History
| Year | Tax Paid | Tax Assessment Tax Assessment Total Assessment is a certain percentage of the fair market value that is determined by local assessors to be the total taxable value of land and additions on the property. | Land | Improvement |
|---|---|---|---|---|
| 2025 | $1,315 | $151,250 | -- | -- |
| 2024 | $1,315 | $133,870 | $0 | $0 |
| 2023 | $1,450 | $147,950 | $0 | $0 |
| 2022 | $1,323 | $132,770 | $0 | $0 |
| 2021 | $1,103 | $177,500 | $21,300 | $156,200 |
| 2020 | $1,074 | $169,100 | $20,300 | $148,800 |
| 2019 | $997 | $161,000 | $22,000 | $139,000 |
| 2018 | $967 | $150,500 | $22,000 | $128,500 |
| 2017 | $923 | $77,275 | $0 | $0 |
| 2016 | $827 | $68,750 | $0 | $0 |
| 2015 | $768 | $63,415 | $0 | $0 |
| 2014 | -- | $63,415 | $0 | $0 |
Source: Public Records
Map
Nearby Homes
- 1299 E 1670 N Unit 812
- 1299 E 1670 N
- 1298 1670 N
- 283 E 1250 N
- 283 E 1250 N Unit 64
- 1058 E 100 N
- 981 E 100 S
- 977 E 100 S
- 791 E 100 S
- 332 N 500 E
- 862 E 200 S
- 412 S Goosenest Dr
- 426 S Goosenest Dr
- 339 N 500 E Unit 3
- 327 N 500 E Unit 2
- 331 N 500 E Unit 2
- 1216 E Loafer View Dr
- 446 N 460 E Unit 9
- 443 E 450 N
- 433 E 450 N
- 214 N 1140 E Unit 1
- 218 N 1140 E
- 224 N 1140 E
- 224 N 1140 E Unit 3-12
- 224 N 1140 E Unit 3
- 228 N 1140 E
- 228 N 1140 E Unit 4
- 236 N 1140 E
- 236 N 1140 E Unit 5
- 1175 Highway 198
- 1175 Utah 198
- 242 N 1140 E
- 242 N 1140 E Unit 6
- 1175 E 100 N
- 211 N 1140 E
- 207 N 1140 E
- 248 N 1140 E Unit 7
- 197 N 1140 E
- 193 N 1140 E
- 254 N 1140 E
Your Personal Tour Guide
Ask me questions while you tour the home.