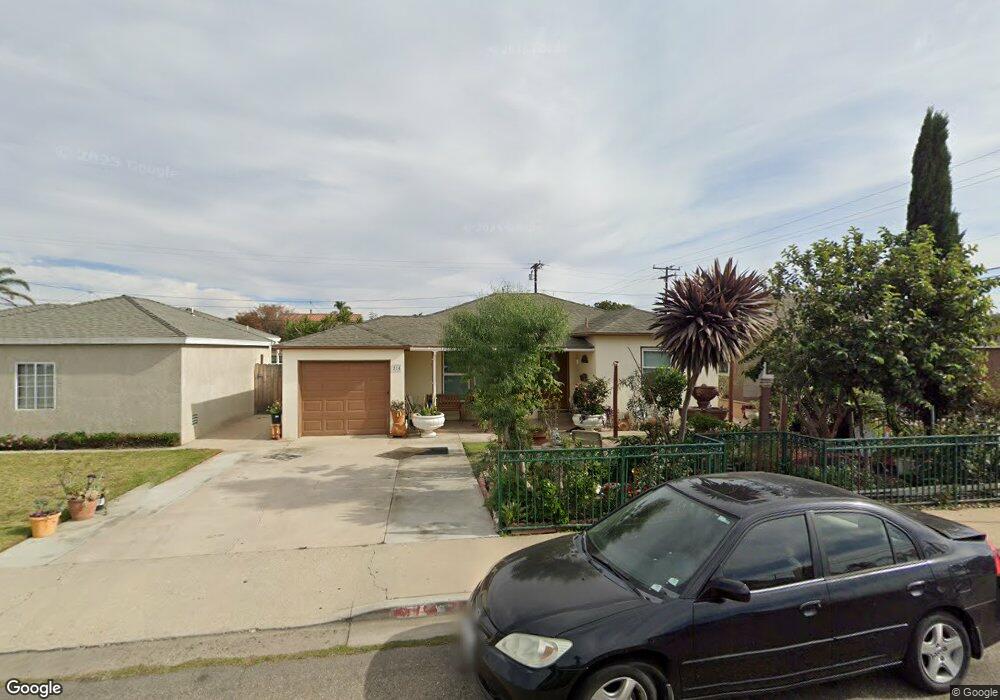
214 N I St Oxnard, CA 93030
Fremont South NeighborhoodEstimated Value: $736,000 - $794,000
3
Beds
2
Baths
1,167
Sq Ft
$656/Sq Ft
Est. Value
About This Home
This home is located at 214 N I St, Oxnard, CA 93030 and is currently estimated at $765,084, approximately $655 per square foot. 214 N I St is a home located in Ventura County with nearby schools including Emilie Ritchen Elementary School, Pacifica High School, and Vista Real Charter High School.
Ownership History
Date
Name
Owned For
Owner Type
Purchase Details
Closed on
Aug 30, 2005
Sold by
Ribota Richard and Ribota Sandra
Bought by
Ramos Maria I
Current Estimated Value
Home Financials for this Owner
Home Financials are based on the most recent Mortgage that was taken out on this home.
Original Mortgage
$460,000
Outstanding Balance
$257,877
Interest Rate
6.62%
Mortgage Type
Purchase Money Mortgage
Estimated Equity
$507,207
Purchase Details
Closed on
Feb 14, 1994
Sold by
Miller Marcelle V
Bought by
Ribota Richard and Ribota Sandra
Home Financials for this Owner
Home Financials are based on the most recent Mortgage that was taken out on this home.
Original Mortgage
$143,165
Interest Rate
7.15%
Create a Home Valuation Report for This Property
The Home Valuation Report is an in-depth analysis detailing your home's value as well as a comparison with similar homes in the area
Home Values in the Area
Average Home Value in this Area
Purchase History
| Date | Buyer | Sale Price | Title Company |
|---|---|---|---|
| Ramos Maria I | $575,000 | Fidelity National Title | |
| Ribota Richard | $151,000 | First American Title Ins Co |
Source: Public Records
Mortgage History
| Date | Status | Borrower | Loan Amount |
|---|---|---|---|
| Open | Ramos Maria I | $460,000 | |
| Previous Owner | Ribota Richard | $143,165 |
Source: Public Records
Tax History
| Year | Tax Paid | Tax Assessment Tax Assessment Total Assessment is a certain percentage of the fair market value that is determined by local assessors to be the total taxable value of land and additions on the property. | Land | Improvement |
|---|---|---|---|---|
| 2025 | $8,140 | $729,000 | $474,000 | $255,000 |
| 2024 | $8,140 | $665,000 | $432,000 | $233,000 |
| 2023 | $7,624 | $634,000 | $412,000 | $222,000 |
| 2022 | $7,351 | $618,000 | $402,000 | $216,000 |
| 2021 | $6,651 | $553,000 | $359,000 | $194,000 |
| 2020 | $6,185 | $500,000 | $421,000 | $79,000 |
| 2019 | $5,736 | $468,000 | $394,000 | $74,000 |
| 2018 | $5,532 | $449,000 | $378,000 | $71,000 |
| 2017 | $5,114 | $429,000 | $361,000 | $68,000 |
| 2016 | $4,880 | $416,000 | $350,000 | $66,000 |
| 2015 | $4,328 | $360,000 | $303,000 | $57,000 |
| 2014 | $3,815 | $315,000 | $264,000 | $51,000 |
Source: Public Records
Map
Nearby Homes
- 307 N F St Unit 102
- 1150 W 1st St
- 1131 W 2nd St
- 462 N M St
- 151 S F St
- 1127 Douglas Ave
- 201 203 S E St
- 425 W 1st St
- 722 W Robert Ave
- 800 S A St
- 715 W Robert Ave
- 246 Doris Ave
- 255 Douglas Ave
- 550 S G St
- 1341 Edgewood Way Unit 23
- 603 S G St
- 411 Eastwood Dr
- 807 Kingfisher Way
- 400 N Hayes Ave
- 729 Ivywood Dr
Your Personal Tour Guide
Ask me questions while you tour the home.