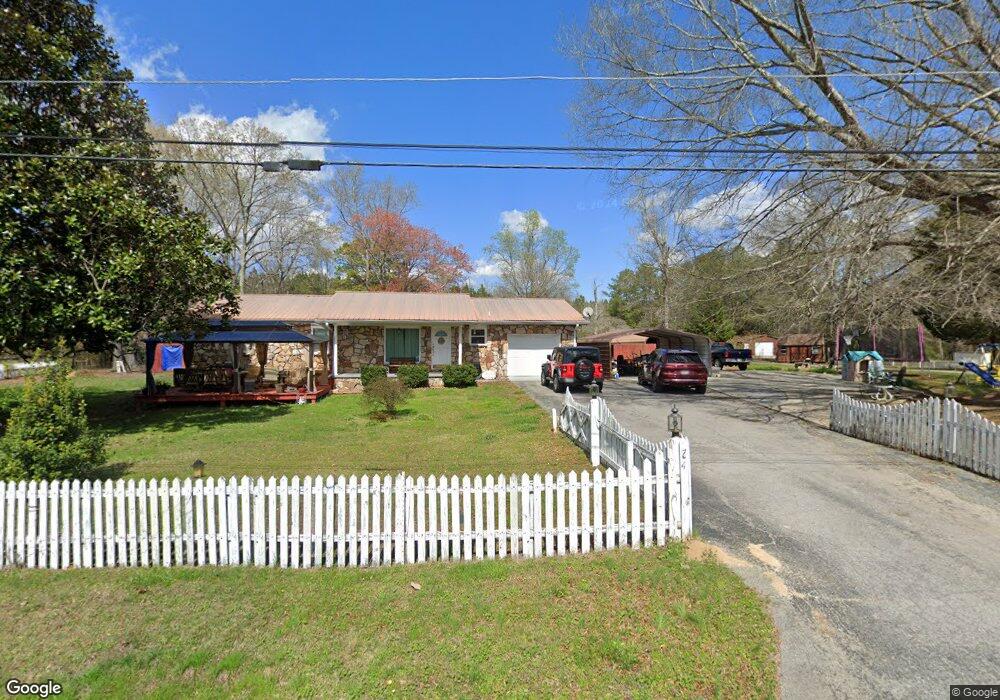
214 Starlight Dr Rock Spring, GA 30739
Rock Spring NeighborhoodEstimated Value: $214,000 - $296,000
--
Bed
2
Baths
1,296
Sq Ft
$194/Sq Ft
Est. Value
About This Home
This home is located at 214 Starlight Dr, Rock Spring, GA 30739 and is currently estimated at $251,297, approximately $193 per square foot. 214 Starlight Dr is a home located in Walker County with nearby schools including Rock Spring Elementary School, Lafayette High School, and Alice M Daley Adventist School.
Ownership History
Date
Name
Owned For
Owner Type
Purchase Details
Closed on
Nov 20, 2023
Sold by
Williams Roger A
Bought by
Williams Randall L
Current Estimated Value
Purchase Details
Closed on
Sep 16, 1997
Sold by
Williams Ronald L
Bought by
Williams Roger A and Williams Judy I
Purchase Details
Closed on
Mar 26, 1993
Sold by
Prudential Home Mortgage Co
Bought by
Williams Ronald L
Purchase Details
Closed on
Oct 6, 1992
Sold by
Lemons Kenneth M
Bought by
Secretary Of Housing & Urban
Purchase Details
Closed on
Oct 15, 1991
Sold by
Couch Glenn L
Bought by
Lemons Kenneth M
Purchase Details
Closed on
Feb 13, 1987
Sold by
Couch Glenn L and Couch Sharon V
Bought by
Couch Glenn L
Purchase Details
Closed on
May 1, 1985
Bought by
Couch Glenn L and Couch Sharon V
Create a Home Valuation Report for This Property
The Home Valuation Report is an in-depth analysis detailing your home's value as well as a comparison with similar homes in the area
Home Values in the Area
Average Home Value in this Area
Purchase History
| Date | Buyer | Sale Price | Title Company |
|---|---|---|---|
| Williams Randall L | -- | -- | |
| Williams Roger A | -- | -- | |
| Williams Ronald L | -- | -- | |
| Secretary Of Housing & Urban | -- | -- | |
| Prudential Home Mortgage Co | -- | -- | |
| Lemons Kenneth M | $68,500 | -- | |
| Couch Glenn L | -- | -- | |
| Couch Glenn L | $50,000 | -- |
Source: Public Records
Tax History Compared to Growth
Tax History
| Year | Tax Paid | Tax Assessment Tax Assessment Total Assessment is a certain percentage of the fair market value that is determined by local assessors to be the total taxable value of land and additions on the property. | Land | Improvement |
|---|---|---|---|---|
| 2024 | $1,798 | $75,453 | $10,873 | $64,580 |
| 2023 | $1,764 | $72,395 | $10,873 | $61,522 |
| 2022 | $1,583 | $64,563 | $10,873 | $53,690 |
| 2021 | $1,355 | $49,625 | $10,873 | $38,752 |
| 2020 | $1,269 | $44,677 | $10,873 | $33,804 |
| 2019 | $1,291 | $44,677 | $10,873 | $33,804 |
| 2018 | $1,182 | $44,677 | $10,873 | $33,804 |
| 2017 | $1,414 | $44,677 | $10,873 | $33,804 |
| 2016 | $1,174 | $44,677 | $10,873 | $33,804 |
| 2015 | $1,201 | $43,121 | $13,316 | $29,805 |
| 2014 | $1,102 | $43,121 | $13,316 | $29,805 |
| 2013 | -- | $43,120 | $13,316 | $29,804 |
Source: Public Records
Map
Nearby Homes
- 5602 Georgia 95
- 00 Georgia 95
- 10180 Us Highway 27
- 1003 Highway N Old 27
- 1370 Old Highway 27
- 701 Bicentennial Trail
- 15 Willow Cir
- 23 Willow Cir
- 16 Willow Cir
- 11 Willow Cir
- The Pearson Plan at Laurel Ridge
- The Benson II Plan at Laurel Ridge
- The Langford Plan at Laurel Ridge
- The Lawson Plan at Laurel Ridge
- The Piedmont Plan at Laurel Ridge
- The Coleman Plan at Laurel Ridge
- The McGinnis Plan at Laurel Ridge
- The Caldwell Plan at Laurel Ridge
- 202 Starlight Dr
- 158 Starlight Dr
- 278 Starlight Dr
- 207 Starlight Dr
- 124 Starlight Dr
- 0 Starlight Dr Unit 19579
- 0 Starlight Dr Unit 1097074
- 0 Starlight Dr Unit 1075777
- 0 Starlight Dr
- 161 Starlight Dr
- 840 Highway 95
- 294 Starlight Dr
- 94 Starlight Dr
- 123 Starlight Dr
- 814 Highway 95
- 293 Starlight Dr
- 914 Georgia 95
- 99 Starlight Dr
- 242 Moon Beam Cir
- 914 Highway 95