Estimated Value: $236,000 - $269,000
2
Beds
1
Bath
896
Sq Ft
$282/Sq Ft
Est. Value
About This Home
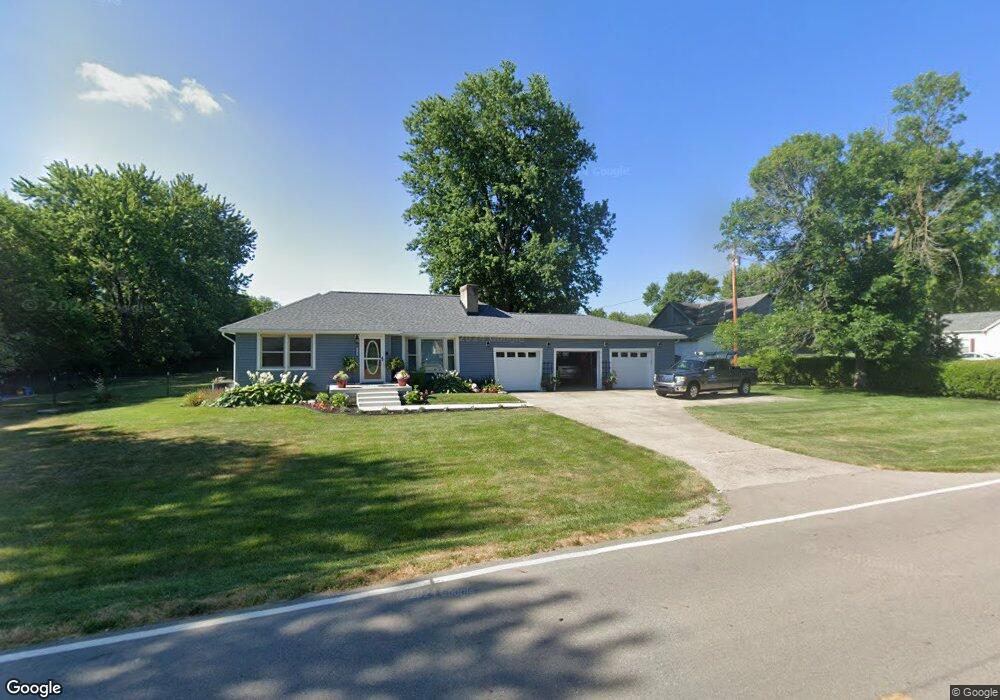
This home is located at 2140 Fenner Rd, Troy, OH 45373 and is currently estimated at $252,828, approximately $282 per square foot. 2140 Fenner Rd is a home located in Miami County with nearby schools including Concord Elementary School, Van Cleve Elementary School, and Troy Junior High School.
Ownership History
Date
Name
Owned For
Owner Type
Purchase Details
Closed on
May 4, 2007
Sold by
Belder Richard L
Bought by
Gochnour Butch
Current Estimated Value
Home Financials for this Owner
Home Financials are based on the most recent Mortgage that was taken out on this home.
Original Mortgage
$134,000
Outstanding Balance
$79,217
Interest Rate
6.2%
Mortgage Type
New Conventional
Estimated Equity
$173,611
Purchase Details
Closed on
Nov 30, 2005
Sold by
Mulford Arlen C and Mulford Marjorie L
Bought by
Belden Richard L
Home Financials for this Owner
Home Financials are based on the most recent Mortgage that was taken out on this home.
Original Mortgage
$94,000
Interest Rate
6.17%
Mortgage Type
New Conventional
Purchase Details
Closed on
Oct 3, 2005
Sold by
Mulford Arlen C
Bought by
Mulford Marjorie L
Home Financials for this Owner
Home Financials are based on the most recent Mortgage that was taken out on this home.
Original Mortgage
$94,000
Interest Rate
6.17%
Mortgage Type
New Conventional
Purchase Details
Closed on
Jan 1, 1990
Bought by
Mulford Arlan C
Create a Home Valuation Report for This Property
The Home Valuation Report is an in-depth analysis detailing your home's value as well as a comparison with similar homes in the area
Purchase History
| Date | Buyer | Sale Price | Title Company |
|---|---|---|---|
| Gochnour Butch | $134,000 | -- | |
| Belden Richard L | $119,000 | -- | |
| Mulford Marjorie L | -- | -- | |
| Mulford Arlan C | -- | -- |
Source: Public Records
Mortgage History
| Date | Status | Borrower | Loan Amount |
|---|---|---|---|
| Open | Mulford Marjorie L | $134,000 | |
| Previous Owner | Mulford Marjorie L | $94,000 |
Source: Public Records
Tax History
| Year | Tax Paid | Tax Assessment Tax Assessment Total Assessment is a certain percentage of the fair market value that is determined by local assessors to be the total taxable value of land and additions on the property. | Land | Improvement |
|---|---|---|---|---|
| 2025 | $2,402 | $67,310 | $19,640 | $47,670 |
| 2024 | $2,402 | $61,500 | $17,470 | $44,030 |
| 2023 | $2,393 | $61,500 | $17,470 | $44,030 |
| 2022 | $2,005 | $61,500 | $17,470 | $44,030 |
| 2021 | $1,712 | $47,320 | $13,440 | $33,880 |
| 2020 | $1,645 | $47,320 | $13,440 | $33,880 |
| 2019 | $1,660 | $47,320 | $13,440 | $33,880 |
| 2018 | $1,437 | $39,000 | $12,640 | $26,360 |
| 2017 | $1,450 | $39,000 | $12,640 | $26,360 |
| 2016 | $1,430 | $39,000 | $12,640 | $26,360 |
| 2015 | $1,487 | $39,000 | $12,640 | $26,360 |
| 2014 | $1,487 | $39,000 | $12,640 | $26,360 |
| 2013 | $1,497 | $39,000 | $12,640 | $26,360 |
Source: Public Records
Map
Nearby Homes
- 612 Barnhart Rd
- 606 Barnhart Rd
- 2024 State Route 718
- 536 Barnhart Rd
- 535 Barnhart Rd
- 1345 Kenton Way
- 2586 Renwick Way
- 2813 Amberwood Dr
- 2863 Netherfield Cir
- 1985 Fox Run
- 1173 Parkview Dr
- 1371 Edinburgh Dr
- 2944 Hoying Dr
- 2928 Hoying Dr
- 2904 Hoying Dr
- 2880 Manor Ct
- 1181 Winchester Dr
- 1811 Greenbriar Dr
- 2927 Huntington Dr
- 1481 Lantern Ln
- 2180 Fenner Rd
- 2145 Fenner Rd
- 2125 Fenner Rd
- 2177 Fenner Rd
- 2105 Fenner Rd
- 2196 Fenner Rd
- 2199 Fenner Rd
- 2077 Fenner Rd
- 2222 Fenner Rd
- 2225 Fenner Rd
- 2055 Fenner Rd
- 2244 Fenner Rd
- 2033 Fenner Rd
- 2266 Fenner Rd
- 2255 Fenner Rd
- 906 Barnhart Rd
- 2285 Fenner Rd
- 874 Barnhart Rd
- 852 Barnhart Rd
- 909 Barnhart Rd
Your Personal Tour Guide
Ask me questions while you tour the home.