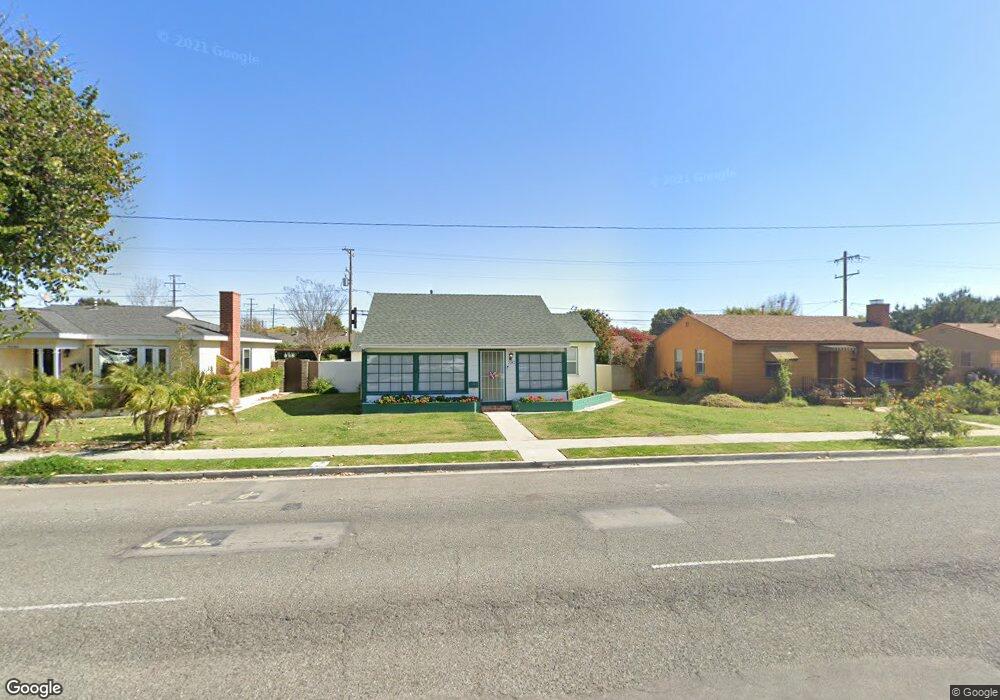
2142 Clark Ave Long Beach, CA 90815
Los Altos South NeighborhoodEstimated Value: $805,000 - $916,000
2
Beds
1
Bath
1,080
Sq Ft
$796/Sq Ft
Est. Value
About This Home
This home is located at 2142 Clark Ave, Long Beach, CA 90815 and is currently estimated at $859,700, approximately $796 per square foot. 2142 Clark Ave is a home located in Los Angeles County with nearby schools including Bixby Elementary School, Stanford Middle School, and Woodrow Wilson High School.
Ownership History
Date
Name
Owned For
Owner Type
Purchase Details
Closed on
Jan 11, 2024
Sold by
Flores Patricia Ann
Bought by
Patricia Ann Flores Living Trust and Flores
Current Estimated Value
Purchase Details
Closed on
Mar 28, 2022
Sold by
Bonnie M Virga Living Trust
Bought by
Flores Patricia A
Home Financials for this Owner
Home Financials are based on the most recent Mortgage that was taken out on this home.
Original Mortgage
$449,600
Interest Rate
3.85%
Mortgage Type
New Conventional
Purchase Details
Closed on
Mar 6, 2014
Sold by
Virga Bonnie M
Bought by
Virga Bonnie M and The Bonnie M Virga Living Trust
Purchase Details
Closed on
Oct 13, 2004
Sold by
Virga Frank J and Virga Bonnie M
Bought by
Virga Frank J
Purchase Details
Closed on
Mar 18, 2004
Sold by
Virga Frank J and Virga Bonnie M
Bought by
Virga Frank J
Purchase Details
Closed on
Oct 13, 2003
Sold by
Virga Frank J and Virga Bonnie M
Bought by
Virga Frank J
Purchase Details
Closed on
Sep 9, 1993
Sold by
Lucas Marty
Bought by
Virga Frank J and Virga Bonnie M
Create a Home Valuation Report for This Property
The Home Valuation Report is an in-depth analysis detailing your home's value as well as a comparison with similar homes in the area
Home Values in the Area
Average Home Value in this Area
Purchase History
| Date | Buyer | Sale Price | Title Company |
|---|---|---|---|
| Patricia Ann Flores Living Trust | -- | None Listed On Document | |
| Flores Patricia A | $562,000 | First American Title Company O | |
| Virga Bonnie M | -- | None Available | |
| Virga Frank J | -- | -- | |
| Virga Frank J | -- | -- | |
| Virga Frank J | -- | -- | |
| Virga Frank J | -- | -- |
Source: Public Records
Mortgage History
| Date | Status | Borrower | Loan Amount |
|---|---|---|---|
| Previous Owner | Flores Patricia A | $449,600 |
Source: Public Records
Tax History
| Year | Tax Paid | Tax Assessment Tax Assessment Total Assessment is a certain percentage of the fair market value that is determined by local assessors to be the total taxable value of land and additions on the property. | Land | Improvement |
|---|---|---|---|---|
| 2025 | $10,257 | $817,129 | $604,888 | $212,241 |
| 2024 | $10,257 | $801,108 | $593,028 | $208,080 |
| 2023 | $10,085 | $785,400 | $581,400 | $204,000 |
| 2022 | $3,527 | $264,242 | $192,184 | $72,058 |
| 2021 | $3,453 | $259,062 | $188,416 | $70,646 |
| 2020 | $3,443 | $256,407 | $186,485 | $69,922 |
| 2019 | $3,403 | $251,380 | $182,829 | $68,551 |
| 2018 | $3,263 | $246,452 | $179,245 | $67,207 |
| 2016 | $3,001 | $236,885 | $172,286 | $64,599 |
| 2015 | $2,884 | $233,328 | $169,699 | $63,629 |
| 2014 | $2,868 | $228,758 | $166,375 | $62,383 |
Source: Public Records
Map
Nearby Homes
- 2221 Granada Ave
- 1908 Clark Ave
- 2171 Stearnlee Ave
- 5020 E Atherton St
- 5140 E Atherton St Unit 35
- 5110 E Atherton St Unit 62
- 5449 E Fairbrook St
- 1770 Ximeno Ave Unit 314
- 2380 Argonne Ave
- 2324 Roycroft Ave
- 5300 E Atherton St Unit 2F
- 4769 E Malta St
- 1591 Ramillo Ave
- 4201 E Jacinto Way
- 4121 Hathaway Ave Unit 3
- 1507 Ramillo Ave
- 2409 Pepperwood Ave
- 2038 San Anseline Ave
- 4110 Hathaway Ave
- 5401 E El Parque St
- 2136 Clark Ave
- 2146 Clark Ave
- 2130 Clark Ave
- 2152 Clark Ave
- 2143 N Greenbrier Rd
- 2137 N Greenbrier Rd
- 2147 N Greenbrier Rd
- 2124 Clark Ave
- 2131 N Greenbrier Rd
- 2153 N Greenbrier Rd
- 2158 Clark Ave
- 2125 N Greenbrier Rd
- 2159 N Greenbrier Rd
- 2121 N Greenbrier Rd
- 2114 Clark Ave
- 2142 N Greenbrier Rd
- 2136 N Greenbrier Rd
- 2146 N Greenbrier Rd
- 2115 N Greenbrier Rd
- 2130 N Greenbrier Rd
Your Personal Tour Guide
Ask me questions while you tour the home.