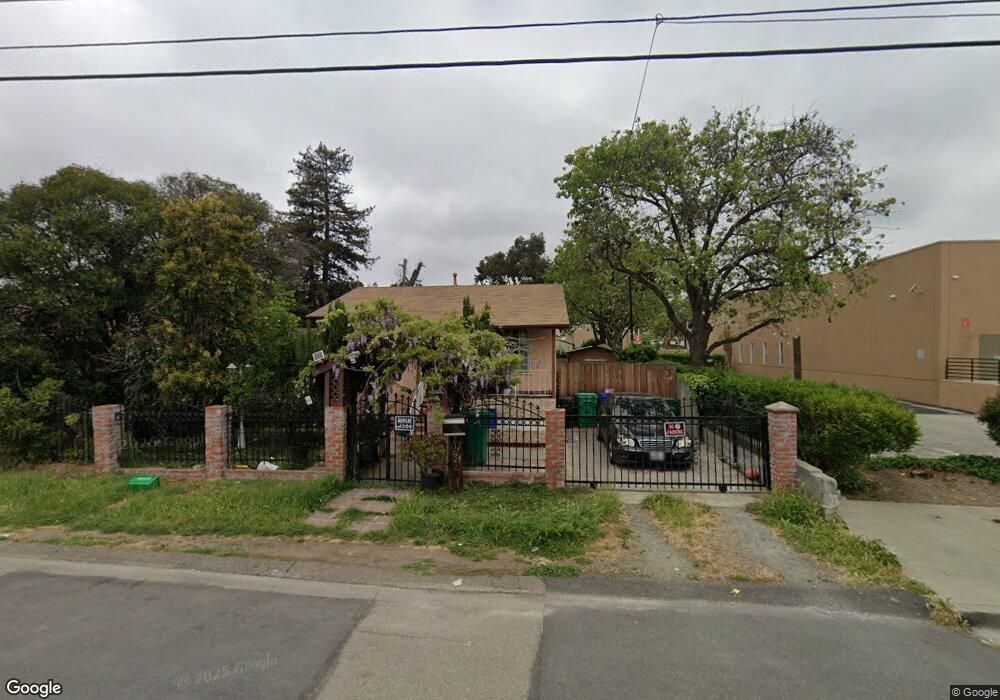
21422 Locust St Hayward, CA 94541
Estimated Value: $610,000 - $844,000
2
Beds
1
Bath
890
Sq Ft
$780/Sq Ft
Est. Value
About This Home
This home is located at 21422 Locust St, Hayward, CA 94541 and is currently estimated at $694,088, approximately $779 per square foot. 21422 Locust St is a home located in Alameda County with nearby schools including Bret Harte Middle School, Hayward High School, and Key Academy Charter School.
Ownership History
Date
Name
Owned For
Owner Type
Purchase Details
Closed on
May 17, 2004
Sold by
Abad Carlos
Bought by
Abad Carlos and Garcia Angelica Leon
Current Estimated Value
Home Financials for this Owner
Home Financials are based on the most recent Mortgage that was taken out on this home.
Original Mortgage
$265,000
Outstanding Balance
$126,603
Interest Rate
5.77%
Mortgage Type
New Conventional
Estimated Equity
$567,485
Purchase Details
Closed on
Sep 16, 2002
Sold by
Leon Angelica
Bought by
Abad Carlos
Home Financials for this Owner
Home Financials are based on the most recent Mortgage that was taken out on this home.
Original Mortgage
$260,950
Interest Rate
6.24%
Purchase Details
Closed on
Aug 18, 1993
Sold by
Albert George L and Albert Marilouise
Bought by
Albert George L and Albert Marilouise
Create a Home Valuation Report for This Property
The Home Valuation Report is an in-depth analysis detailing your home's value as well as a comparison with similar homes in the area
Home Values in the Area
Average Home Value in this Area
Purchase History
| Date | Buyer | Sale Price | Title Company |
|---|---|---|---|
| Abad Carlos | -- | Commonwealth Land Title | |
| Abad Carlos | -- | North American Title Co | |
| Abad Carlos | $290,000 | North American Title Co | |
| Albert George L | -- | -- | |
| Albert George L | -- | -- |
Source: Public Records
Mortgage History
| Date | Status | Borrower | Loan Amount |
|---|---|---|---|
| Open | Abad Carlos | $265,000 | |
| Closed | Abad Carlos | $260,950 |
Source: Public Records
Tax History
| Year | Tax Paid | Tax Assessment Tax Assessment Total Assessment is a certain percentage of the fair market value that is determined by local assessors to be the total taxable value of land and additions on the property. | Land | Improvement |
|---|---|---|---|---|
| 2025 | $5,692 | $419,977 | $125,993 | $293,984 |
| 2024 | $5,692 | $411,744 | $123,523 | $288,221 |
| 2023 | $5,638 | $403,673 | $121,102 | $282,571 |
| 2022 | $5,507 | $395,760 | $118,728 | $277,032 |
| 2021 | $5,435 | $388,001 | $116,400 | $271,601 |
| 2020 | $5,346 | $384,026 | $115,208 | $268,818 |
| 2019 | $5,364 | $376,497 | $112,949 | $263,548 |
| 2018 | $5,041 | $369,117 | $110,735 | $258,382 |
| 2017 | $4,916 | $361,881 | $108,564 | $253,317 |
| 2016 | $4,631 | $354,788 | $106,436 | $248,352 |
| 2015 | $4,531 | $349,461 | $104,838 | $244,623 |
| 2014 | $3,742 | $290,000 | $87,000 | $203,000 |
Source: Public Records
Map
Nearby Homes
- 1239 Grove Way
- 21447 Ocean View Dr
- 1516 Grove Way
- 21117 Gary Dr Unit 116
- 21117 Gary Dr Unit 106
- 21228 Gary Dr Unit 105
- 20917 Locust St
- 21492 Montgomery Ave
- 21109 Gary Dr Unit 303
- 1124 Rex Rd
- 21071 Gary Dr Unit 204
- 22128 Prospect St
- 688 Grove Way
- 22157 Main St
- 823 Blossom Way
- 21259 Hobert St
- 1005 Imperial Place
- 22133 Peralta St
- 22168 Peralta St
- 22234 Prospect St
- 21412 Locust St
- 21408 Locust St
- 21380 Locust St
- 21390 Locust St
- 21415 Locust St
- 21413 Foothill Blvd
- 21413 Locust St
- 21395 Foothill Blvd
- 21427 Foothill Blvd
- 21382 Locust St
- 21437 Locust St
- 21411 Locust St
- 21365 Foothill Blvd
- 21407 Locust St
- 21459 Locust St
- 21391 Locust St
- 21358 Locust St
- 21377 Locust St
- 1262 Grove Way
- 1248 Grove Way
Your Personal Tour Guide
Ask me questions while you tour the home.