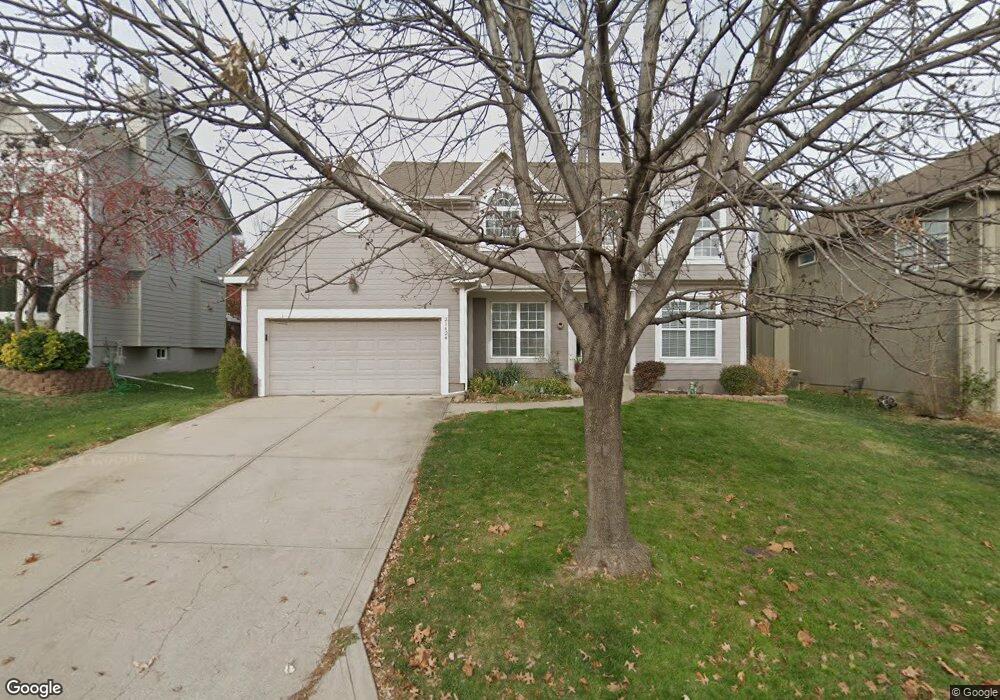
21424 W 48th St Shawnee, KS 66218
Estimated Value: $442,139 - $486,000
4
Beds
4
Baths
2,297
Sq Ft
$201/Sq Ft
Est. Value
About This Home
This home is located at 21424 W 48th St, Shawnee, KS 66218 and is currently estimated at $461,785, approximately $201 per square foot. 21424 W 48th St is a home located in Johnson County with nearby schools including Riverview Elementary School, Mill Creek Middle School, and Mill Valley High School.
Ownership History
Date
Name
Owned For
Owner Type
Purchase Details
Closed on
Mar 2, 2005
Sold by
Cross Douglas and Cross Marzena
Bought by
Nicot Christopher P and Nicot Janitzia C
Current Estimated Value
Home Financials for this Owner
Home Financials are based on the most recent Mortgage that was taken out on this home.
Original Mortgage
$75,000
Interest Rate
5.87%
Mortgage Type
New Conventional
Purchase Details
Closed on
Apr 3, 2003
Sold by
Apple Heather A and Apple Jason N
Bought by
Cross Douglas and Cross Marzena
Home Financials for this Owner
Home Financials are based on the most recent Mortgage that was taken out on this home.
Original Mortgage
$155,000
Interest Rate
5.64%
Purchase Details
Closed on
Mar 7, 2001
Sold by
Apple Jason N and Apple Heather A
Bought by
Apple Heather A and Apple Jason N
Create a Home Valuation Report for This Property
The Home Valuation Report is an in-depth analysis detailing your home's value as well as a comparison with similar homes in the area
Home Values in the Area
Average Home Value in this Area
Purchase History
| Date | Buyer | Sale Price | Title Company |
|---|---|---|---|
| Nicot Christopher P | -- | Old Republic Title Company | |
| Cross Douglas | -- | Security Land Title Company | |
| Apple Heather A | -- | -- |
Source: Public Records
Mortgage History
| Date | Status | Borrower | Loan Amount |
|---|---|---|---|
| Previous Owner | Nicot Christopher P | $75,000 | |
| Previous Owner | Cross Douglas | $155,000 |
Source: Public Records
Tax History Compared to Growth
Tax History
| Year | Tax Paid | Tax Assessment Tax Assessment Total Assessment is a certain percentage of the fair market value that is determined by local assessors to be the total taxable value of land and additions on the property. | Land | Improvement |
|---|---|---|---|---|
| 2024 | $5,458 | $46,966 | $8,938 | $38,028 |
| 2023 | $5,283 | $44,942 | $8,125 | $36,817 |
| 2022 | $5,007 | $41,722 | $7,383 | $34,339 |
| 2021 | $4,877 | $39,066 | $7,036 | $32,030 |
| 2020 | $4,272 | $33,891 | $5,864 | $28,027 |
| 2019 | $4,201 | $32,832 | $5,584 | $27,248 |
| 2018 | $3,976 | $30,797 | $5,584 | $25,213 |
| 2017 | $4,025 | $30,417 | $4,856 | $25,561 |
| 2016 | $3,932 | $29,348 | $4,418 | $24,930 |
| 2015 | $3,813 | $27,991 | $4,418 | $23,573 |
| 2013 | -- | $26,266 | $4,418 | $21,848 |
Source: Public Records
Map
Nearby Homes
- 4713 Lone Elm
- 21222 W 48th St
- 4754 Lakecrest Dr
- 21408 W 50th St
- 4531 Woodstock St
- 21525 W 51st St
- 20823 W 45th Terrace
- 22014 W 47th Terrace
- 5015 Millbrook St
- 22014 W 51st St
- 5116 Payne St
- 5005 Hilltop Dr
- 21804 W 52nd Terrace
- 5206 Round Prairie St
- 22115 W 51st Terrace
- 4638 Aminda St
- 5311 Brownridge Dr
- 5307 Noble St
- 21624 W 53rd Terrace
- 22611 W 46th Terrace
- 21418 W 48th St
- 21430 W 48th St
- 21423 W 47th Ct
- 21412 W 48th St
- 21429 W 47th Ct
- 21417 W 47th Ct
- 21436 W 48th St
- 21435 W 47th Ct
- 4805 Mund Rd
- 21411 W 47th Ct
- 21406 W 48th St
- 21441 W 47th Ct
- 4811 Mund Rd
- 21415 W 48th St
- 4802 Brownridge Dr
- 21314 W 48th St
- 21405 W 47th Ct
- 21426 W 47th Ct
- 21432 W 47th Ct
- 4760 Mund Rd