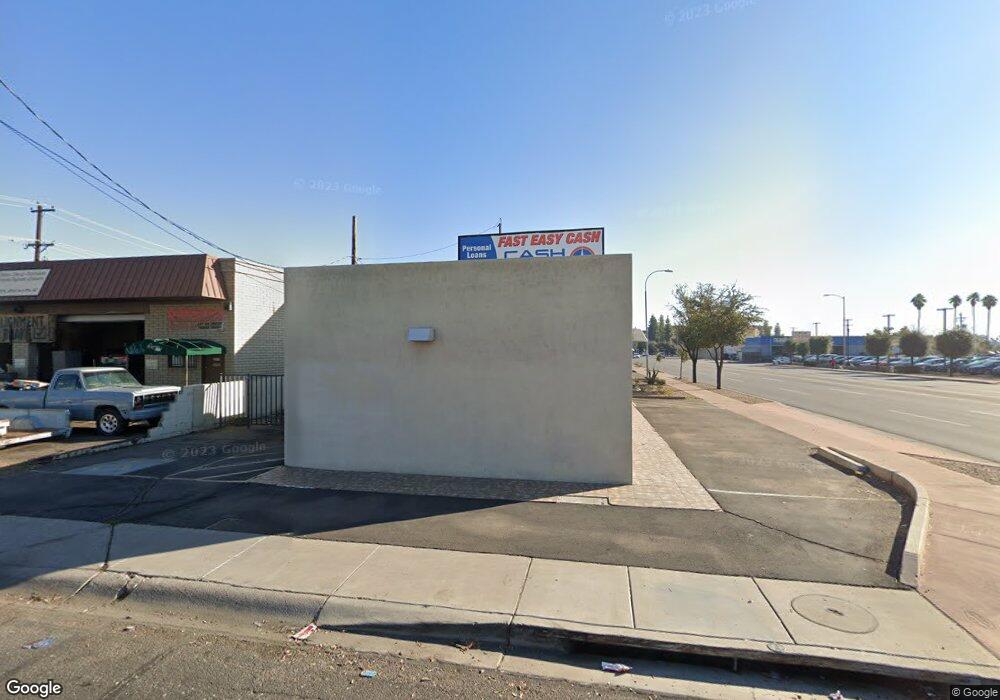
2144 W Camelback Rd Phoenix, AZ 85015
Alhambra NeighborhoodEstimated Value: $446,513
Studio
--
Bath
2,914
Sq Ft
$153/Sq Ft
Est. Value
About This Home
This home is located at 2144 W Camelback Rd, Phoenix, AZ 85015 and is currently estimated at $446,513, approximately $153 per square foot. 2144 W Camelback Rd is a home located in Maricopa County with nearby schools including Westwood Primary School, Choice Learning Academy, and Central High School.
Ownership History
Date
Name
Owned For
Owner Type
Purchase Details
Closed on
Nov 20, 2025
Sold by
La Insurance Agency Az6 Llc
Bought by
Nks Elite Holdings Llc
Current Estimated Value
Purchase Details
Closed on
May 21, 2025
Sold by
Simons Auto Repair Llc
Bought by
La Insurance Agency Az6 Llc
Purchase Details
Closed on
Apr 3, 2024
Sold by
Wickenburg Investment Llc
Bought by
Simons Auto Repair Llc
Purchase Details
Closed on
Oct 20, 2023
Sold by
Law Office Of Christos Agra Plc
Bought by
Wickenburg Investment Llc
Purchase Details
Closed on
Sep 8, 2015
Sold by
Hs Holdings Llc
Bought by
The Law Office Of Christos Agra Plc
Home Financials for this Owner
Home Financials are based on the most recent Mortgage that was taken out on this home.
Original Mortgage
$97,000
Interest Rate
3.91%
Mortgage Type
Commercial
Purchase Details
Closed on
Nov 3, 2014
Sold by
Marissa Llc
Bought by
Hs Holdings Llc
Purchase Details
Closed on
Oct 22, 2008
Sold by
Kwilos Rudolph G
Bought by
Marissa Llc
Purchase Details
Closed on
Dec 22, 1999
Sold by
Leistner Elbert L
Bought by
Kwilos Rudolph G
Create a Home Valuation Report for This Property
The Home Valuation Report is an in-depth analysis detailing your home's value as well as a comparison with similar homes in the area
Home Values in the Area
Average Home Value in this Area
Purchase History
| Date | Buyer | Sale Price | Title Company |
|---|---|---|---|
| Nks Elite Holdings Llc | -- | Accommodation/Courtesy Recordi | |
| Nks Elite Holdings Llc | -- | Accommodation/Courtesy Recordi | |
| La Insurance Agency Az6 Llc | $450,000 | Commonwealth Land Title | |
| La Insurance Agency Az6 Llc | $450,000 | Commonwealth Land Title | |
| Simons Auto Repair Llc | $345,000 | Commonwealth Land Title | |
| Simons Auto Repair Llc | $345,000 | Commonwealth Land Title | |
| Wickenburg Investment Llc | $350,000 | Chicago Title Agency | |
| Wickenburg Investment Llc | $350,000 | Chicago Title Agency | |
| The Law Office Of Christos Agra Plc | $121,250 | First American Title Ins Co | |
| The Law Office Of Christos Agra Plc | $121,250 | First American Title Ins Co | |
| Hs Holdings Llc | $87,500 | First American Title Ins Co | |
| Hs Holdings Llc | $87,500 | First American Title Ins Co | |
| Marissa Llc | $125,000 | Title Mgmt Agency Of Az Llc | |
| Marissa Llc | $125,000 | Title Mgmt Agency Of Az Llc | |
| Kwilos Rudolph G | -- | -- | |
| Kwilos Rudolph G | -- | -- |
Source: Public Records
Mortgage History
| Date | Status | Borrower | Loan Amount |
|---|---|---|---|
| Previous Owner | The Law Office Of Christos Agra Plc | $97,000 |
Source: Public Records
Tax History
| Year | Tax Paid | Tax Assessment Tax Assessment Total Assessment is a certain percentage of the fair market value that is determined by local assessors to be the total taxable value of land and additions on the property. | Land | Improvement |
|---|---|---|---|---|
| 2025 | $2,531 | $16,009 | -- | -- |
| 2024 | $2,455 | $15,723 | -- | -- |
| 2023 | $2,455 | $21,114 | $10,166 | $10,948 |
| 2022 | $2,488 | $21,473 | $11,375 | $10,098 |
| 2021 | $2,583 | $21,762 | $11,700 | $10,062 |
| 2020 | $2,484 | $19,728 | $9,846 | $9,882 |
| 2019 | $2,453 | $17,748 | $8,280 | $9,468 |
| 2018 | $2,265 | $16,686 | $7,362 | $9,324 |
| 2017 | $2,236 | $15,912 | $7,146 | $8,766 |
| 2016 | $2,142 | $15,138 | $7,164 | $7,974 |
| 2015 | $2,084 | $12,543 | $6,364 | $6,179 |
Source: Public Records
Map
Nearby Homes
- 2106 W Camelback Rd
- 5035 N 23rd Ave
- 5115 N 22nd Ave Unit 3
- 2110 W Mariposa St
- 5141 N 22nd Ave
- 2051 W Elm St
- 2031 W Pierson St
- 2105 W Elm St Unit 1
- 1919 W Colter St Unit d 07
- 4714 N 23rd Ave
- 2128 W Georgia Ave
- 2232 W Georgia Ave
- 2238 W Georgia Ave
- 2244 W Georgia Ave
- 5207 N Black Canyon Hwy Unit 18
- 4643 N 21st Ave
- 4701 N 23rd Dr
- 2030 W Highland Ave
- 2142 W Coolidge St
- 4716 N 20th Ave
- 2150 W Camelback Rd
- 5010 N 22nd Ave Unit OFC
- 5010 N 22nd Ave Unit 112
- 5010 N 22nd Ave Unit 108
- 5010 N 22nd Ave Unit 113
- 5010 N 22nd Ave Unit 14
- 5010 N 22nd Ave Unit 107
- 5010 N 22nd Ave Unit 101
- 5010 N 22nd Ave Unit 106
- 5010 N 22nd Ave
- 5010 N 22nd Ave Unit 103
- 5010 N 22nd Ave Unit 105
- 5010 N 22nd Ave Unit 100
- 5010 N 22nd Ave Unit 109
- 5010 N 22nd Ave Unit 102
- 5010 N 22nd Ave Unit 110
- 5010 N 22nd Ave Unit 111
- 5010 N 22nd Ave Unit 115
- 5010 N 22nd Ave Unit 104
- 5010 N 22nd Ave Unit 114
Your Personal Tour Guide
Ask me questions while you tour the home.