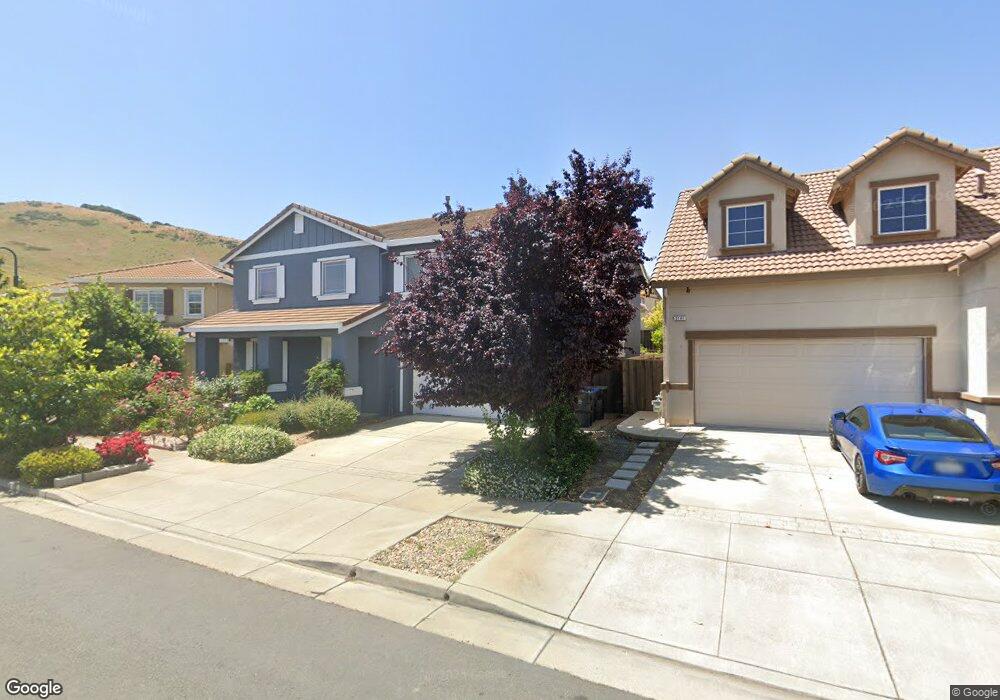
2145 Saddlebred Dr Fairfield, CA 94534
Estimated Value: $784,000 - $843,000
5
Beds
3
Baths
2,924
Sq Ft
$277/Sq Ft
Est. Value
About This Home
This home is located at 2145 Saddlebred Dr, Fairfield, CA 94534 and is currently estimated at $810,646, approximately $277 per square foot. 2145 Saddlebred Dr is a home located in Solano County with nearby schools including Cordelia Hills Elementary School, Green Valley Middle School, and Angelo Rodriguez High School.
Ownership History
Date
Name
Owned For
Owner Type
Purchase Details
Closed on
May 19, 2016
Sold by
Lawson Ty Clinton and Lawson Michelle Leigh
Bought by
Kamat Sanjeet and Kamat Ranjita
Current Estimated Value
Home Financials for this Owner
Home Financials are based on the most recent Mortgage that was taken out on this home.
Original Mortgage
$418,000
Outstanding Balance
$331,887
Interest Rate
3.58%
Mortgage Type
New Conventional
Estimated Equity
$478,759
Purchase Details
Closed on
Sep 18, 2013
Sold by
Lawson Ty C and Lawson Michelle L
Bought by
Lawson Ty Clinton and Lawson Michelle Leigh
Purchase Details
Closed on
Apr 11, 2012
Sold by
West Cosat Home Builders Inc
Bought by
Lawson Ty C and Lawson Michelle L
Home Financials for this Owner
Home Financials are based on the most recent Mortgage that was taken out on this home.
Original Mortgage
$308,000
Interest Rate
3.86%
Mortgage Type
New Conventional
Create a Home Valuation Report for This Property
The Home Valuation Report is an in-depth analysis detailing your home's value as well as a comparison with similar homes in the area
Purchase History
| Date | Buyer | Sale Price | Title Company |
|---|---|---|---|
| Kamat Sanjeet | $550,000 | Old Republic Title Company | |
| Lawson Ty Clinton | -- | None Available | |
| Lawson Ty C | $393,500 | Old Republic Title Company |
Source: Public Records
Mortgage History
| Date | Status | Borrower | Loan Amount |
|---|---|---|---|
| Open | Kamat Sanjeet | $418,000 | |
| Previous Owner | Lawson Ty C | $308,000 |
Source: Public Records
Tax History
| Year | Tax Paid | Tax Assessment Tax Assessment Total Assessment is a certain percentage of the fair market value that is determined by local assessors to be the total taxable value of land and additions on the property. | Land | Improvement |
|---|---|---|---|---|
| 2025 | $7,701 | $651,082 | $177,566 | $473,516 |
| 2024 | $7,701 | $638,317 | $174,085 | $464,232 |
| 2023 | $7,456 | $625,802 | $170,672 | $455,130 |
| 2022 | $7,349 | $613,532 | $167,326 | $446,206 |
| 2021 | $7,258 | $601,503 | $164,046 | $437,457 |
| 2020 | $7,067 | $595,336 | $162,364 | $432,972 |
| 2019 | $6,872 | $583,664 | $159,181 | $424,483 |
| 2018 | $7,082 | $572,220 | $156,060 | $416,160 |
| 2017 | $6,766 | $561,000 | $153,000 | $408,000 |
| 2016 | $5,178 | $417,093 | $100,798 | $316,295 |
| 2015 | $4,851 | $410,828 | $99,284 | $311,544 |
| 2014 | $4,807 | $402,782 | $97,340 | $305,442 |
Source: Public Records
Map
Nearby Homes
- 2149 Saddlebred Dr
- 1844 Stockbridge Dr
- 4758 Antelope Cir
- 4764 Brookside Cir
- 1132 Courtland Ct
- 4732 Opus Cir
- 4817 Dolce Ct
- 848 Crescendo St
- 4881 Regency Place
- 5100 Ramsgate Ct
- 680 Vintage Ct
- 741 Greentree Cir
- 4924 Fairmont Ct
- 5227 Waterleaf Ln
- 680 Silver Lake Dr
- 2318 Pinnacle Point
- 2302 Broadleigh Place
- 2232 Bennington Dr
- 5011 Staghorn Dr
- 1765 Durrow Ct
- 2141 Saddlebred Dr
- 2162 Newfoundland Dr
- 2166 Newfoundland Dr
- 2137 Saddlebred Dr
- 2158 Newfoundland Dr
- 2134 Saddlebred Dr
- 2130 Saddlebred Dr
- 2154 Newfoundland Dr
- 2133 Saddlebred Dr
- 2126 Saddlebred Dr
- 2150 Newfoundland Dr
- 2135 Arabian Dr
- 2129 Saddlebred Dr
- 2131 Arabian Dr
- 2122 Saddlebred Dr
- 2146 Newfoundland Dr
- 2127 Arabian Dr
- 4648 Lariat Dr
- 2118 Saddlebred Dr
- 2125 Saddlebred Dr
Your Personal Tour Guide
Ask me questions while you tour the home.